Samsung 2005 Annual Report Download - page 125
Download and view the complete annual report
Please find page 125 of the 2005 Samsung annual report below. You can navigate through the pages in the report by either clicking on the pages listed below, or by using the keyword search tool below to find specific information within the annual report.-
 1
1 -
2
-
3
-
4
-
5
-
6
-
7
-
8
-
9
-
10
-
11
-
12
-
13
-
14
-
15
-
16
-
17
-
18
-
19
-
20
-
21
-
22
-
23
-
24
-
25
-
26
-
27
-
28
-
29
-
30
-
31
-
32
-
33
-
34
-
35
-
36
-
37
-
38
-
39
-
40
-
41
-
42
-
43
-
44
-
45
-
46
-
47
-
48
-
49
-
50
-
51
-
52
-
53
-
54
-
55
-
56
-
57
-
58
-
59
-
60
-
61
-
62
-
63
-
64
-
65
-
66
-
67
-
68
-
69
-
70
-
71
-
72
-
73
-
74
-
75
-
76
-
77
-
78
-
79
-
80
-
81
-
82
-
83
-
84
-
85
-
86
-
87
-
88
-
89
-
90
-
91
-
92
-
93
-
94
-
95
-
96
-
97
-
98
-
99
-
100
-
101
-
102
-
103
-
104
-
105
-
106
-
107
-
108
-
109
-
110
-
111
-
112
-
113
-
114
-
 115
115 -
 116
116 -
 117
117 -
 118
118 -
 119
119 -
 120
120 -
 121
121 -
 122
122 -
 123
123 -
 124
124 -
 125
125 -
 126
126 -
 127
127 -
 128
128 -
 129
129 -
 130
130 -
 131
131 -
 132
132 -
 133
133 -
 134
134 -
 135
135 -
136
-
137
-
138
-
139
-
140
-
141
-
142
-
143
-
144
-
145
-
146
-
147
-
148
 |
 |

123
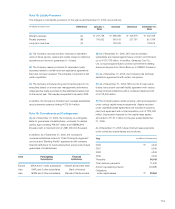
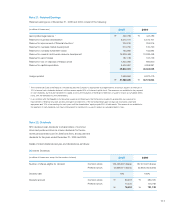
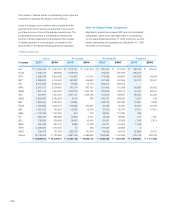
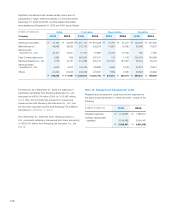
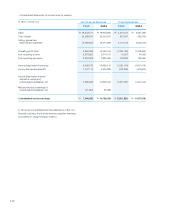
Note 27: Earnings Per Share
Earnings per share is computed by dividing net income by the
weighted-average number of common shares outstanding
during the year. Ordinary income per share is calculated by
dividing ordinary income allocated to common stock, which
is net income allocated to common stock as adjusted by
extraordinary gains or losses, net of related income taxes, by
the weighted-average number of common shares outstanding
during the year.
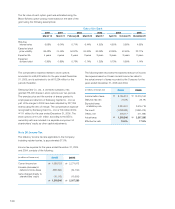
(In millions, except per share and number of share amounts) 2005 2004
Net income as reported on the statements of income \7,640,092 \10,789,535
Adjustments:
Dividends for preferred stock (114,735) (210,586)
Undeclared participating preferred stock dividend (929,242) (1,252,571)
Net income available for common stock 6,596,115 9,326,378
Weighted-average
number of common shares outstanding 132,003,416 137,321,524
Earnings per share \49,969 \67,916
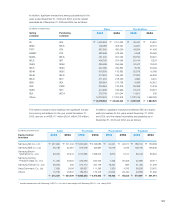
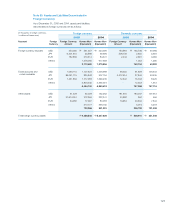
Basic earnings per share for the years ended December 31, 2005 and 2004, is calculated as follows:
(In millions, except per share and number of share amounts) 2005 2004
Net income available for common stock \6,596,115 \9,326,378
Adjustment:
Compensation expense for stock options 2,437 8,284
Net income available for common stock and
common equivalent shares 6,598,552 9,334,662
Weighted-average number of shares of
common stock and common equivalent shares1 outstanding 134,314,164 139,570,829
Diluted earnings per share \49,128 \66,881
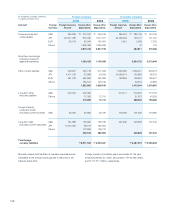
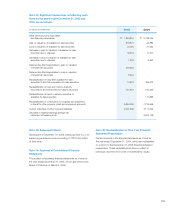
2005 2004
Number of
shares
Weight Common stock
equivalent
Number of
shares
Weight Common stock
equivalent
Stock options 2,310,748 365/365 2,310,748 2,249,305 366/366 2,249,305
1 Common equivalent shares:
Diluted earnings per share for the years ended December 31, 2005 and 2004, is calculated as follows: