Samsung 2005 Annual Report Download - page 71
Download and view the complete annual report
Please find page 71 of the 2005 Samsung annual report below. You can navigate through the pages in the report by either clicking on the pages listed below, or by using the keyword search tool below to find specific information within the annual report.-
 1
1 -
2
-
3
-
4
-
5
-
6
-
7
-
8
-
9
-
10
-
11
-
12
-
13
-
14
-
15
-
16
-
17
-
18
-
19
-
20
-
21
-
22
-
23
-
24
-
25
-
26
-
27
-
28
-
29
-
30
-
31
-
32
-
33
-
34
-
35
-
36
-
37
-
38
-
39
-
40
-
41
-
42
-
43
-
44
-
45
-
46
-
47
-
48
-
49
-
50
-
51
-
52
-
53
-
54
-
55
-
56
-
57
-
58
-
59
-
60
-
 61
61 -
 62
62 -
 63
63 -
 64
64 -
 65
65 -
 66
66 -
 67
67 -
 68
68 -
 69
69 -
 70
70 -
 71
71 -
 72
72 -
 73
73 -
 74
74 -
 75
75 -
 76
76 -
 77
77 -
 78
78 -
 79
79 -
 80
80 -
 81
81 -
82
-
83
-
84
-
85
-
86
-
87
-
88
-
89
-
90
-
91
-
92
-
93
-
94
-
95
-
96
-
97
-
98
-
99
-
100
-
101
-
102
-
103
-
104
-
105
-
106
-
107
-
108
-
109
-
110
-
111
-
112
-
113
-
114
-
115
-
116
-
117
-
118
-
119
-
120
-
121
-
122
-
123
-
124
-
125
-
126
-
127
-
128
-
129
-
130
-
131
-
132
-
133
-
134
-
135
-
136
-
137
-
138
-
139
-
140
-
141
-
142
-
143
-
144
-
145
-
146
-
147
-
148
 |
 |
69
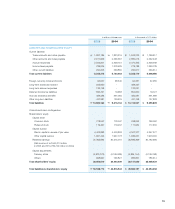
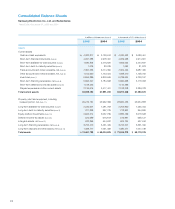
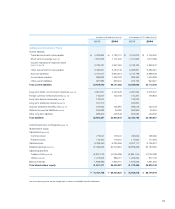
in millions of Korean won in thousands of U.S. dollars
2005 2004 2005 2004
LIABILITIES AND SHAREHOLDERS’ EQUITY
Current liabilities
Trade accounts and notes payable \1,867,185 \ 1,823,316 $ 1,843,223 $ 1,799,917
Other accounts and notes payable 2,917,659 2,595,557 2,880,216 2,562,248
Accrued expenses 2,506,501 2,359,751 2,474,335 2,329,468
Income taxes payable 789,925 1,378,429 779,788 1,360,739
Other current liabilities 264,005 563,850 260,617 556,614
Total current liabilities 8,345,275 8,720,903 8,238,179 8,608,986
Foreign currency notes and bonds 95,557 98,545 94,331 97,280
Long-term advances received 505,950 - 499,457 -
Long-term accrued expenses 133,748 - 132,031 -
Deferred income tax liabilities 865,761 19,983 854,650 19,727
Accrued severance benefits 498,488 397,084 492,091 391,988
Other long-term liabilities 437,381 139,619 431,768 137,828
Total liabilities \10,882,160 \9,376,134 $10,742,507 $9,255,809
Commitments and contingencies
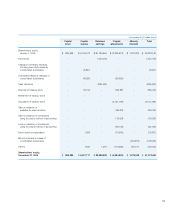
Shareholders’ equity
Capital stock
Common stock 778,047 778,047 768,062 768,062
Preferred stock 119,467 119,467 117,934 117,934
Capital surplus
Paid-in capital in excess of par value 4,403,893 4,403,893 4,347,377 4,347,377
Other capital surplus 1,961,422 1,927,773 1,936,251 1,903,034
Retained earnings 37,365,892 30,575,041 36,886,369 30,182,666
(Net income of \7,640,213 million
in 2005 and \10,786,742 million in 2004)
Capital adjustments
Treasury stock (5,970,778) (4,159,639) (5,894,154) (4,106,258)
Others 998,667 795,827 985,851 785,614
Total shareholders’ equity 39,656,610 34,440,409 39,147,690 33,998,429
Total liabilities & shareholders’ equity \50,538,770 \43,816,543 $49,890,197 $43,254,238