Samsung 2005 Annual Report Download - page 130
Download and view the complete annual report
Please find page 130 of the 2005 Samsung annual report below. You can navigate through the pages in the report by either clicking on the pages listed below, or by using the keyword search tool below to find specific information within the annual report.-
 1
1 -
2
-
3
-
4
-
5
-
6
-
7
-
8
-
9
-
10
-
11
-
12
-
13
-
14
-
15
-
16
-
17
-
18
-
19
-
20
-
21
-
22
-
23
-
24
-
25
-
26
-
27
-
28
-
29
-
30
-
31
-
32
-
33
-
34
-
35
-
36
-
37
-
38
-
39
-
40
-
41
-
42
-
43
-
44
-
45
-
46
-
47
-
48
-
49
-
50
-
51
-
52
-
53
-
54
-
55
-
56
-
57
-
58
-
59
-
60
-
61
-
62
-
63
-
64
-
65
-
66
-
67
-
68
-
69
-
70
-
71
-
72
-
73
-
74
-
75
-
76
-
77
-
78
-
79
-
80
-
81
-
82
-
83
-
84
-
85
-
86
-
87
-
88
-
89
-
90
-
91
-
92
-
93
-
94
-
95
-
96
-
97
-
98
-
99
-
100
-
101
-
102
-
103
-
104
-
105
-
106
-
107
-
108
-
109
-
110
-
111
-
112
-
113
-
114
-
115
-
116
-
117
-
118
-
119
-
 120
120 -
 121
121 -
 122
122 -
 123
123 -
 124
124 -
 125
125 -
 126
126 -
 127
127 -
 128
128 -
 129
129 -
 130
130 -
 131
131 -
 132
132 -
 133
133 -
 134
134 -
 135
135 -
 136
136 -
 137
137 -
 138
138 -
 139
139 -
 140
140 -
141
-
142
-
143
-
144
-
145
-
146
-
147
-
148
 |
 |
128
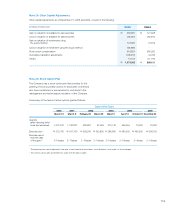
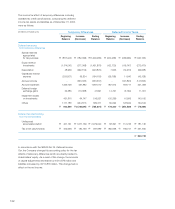
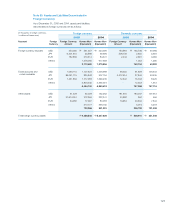
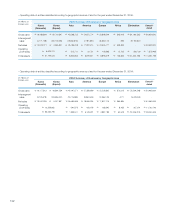
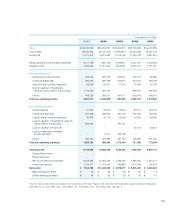
Monetary assets and liabilities of overseas subsidiaries are
translated at the foreign exchange rate in effect as of the
balance sheet date.
Foreign currency translation gains and losses for the year
ended December 31, 2005, amounted to \144,465 million
and \117,571 million, respectively.
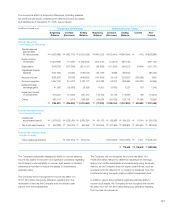
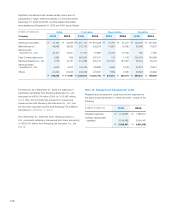
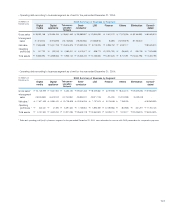
( in thousands of foreign currencies,
in millions of Korean won) Foreign company Domestic company
2005 2004 2005 2004
Account Foreign
Currency
Foreign Currency
Amount
Korean Won
(Equivalent)
Korean Won
(Equivalent)
Foreign Currency
Amount
Korean Won
(Equivalent)
Korean Won
(Equivalent)
Trade accounts and
notes payable
US$ 269,839 \273,347 \246,109 285,423 \289,135 \134,109
JPY 101,911,285 876,335 1,071,811 22,459,462 193,127 141,047
EUR 50,310 60,340 133,303 2,091 2,508 2,792
Others 1,605,396 1,395,936 47 118
2,815,418 2,847,159 484,817 278,066
Short-term borrowings,
(including document
against acceptance) 1,533,423 1,156,508 3,694,725 3,070,848
Other current liabilities US$ 449,927 455,776 571,806 1,026,082 1,039,421 979,418
JPY 4,417,318 37,986 50,544 14,069,274 120,980 98,723
EUR 461,079 552,994 462,686 163,860 196,524 195,677
Others 786,104 723,159 55,319 45,863
1,832,860 1,808,195 1,412,244 1,319,681
Long-term other
accounts payable
US$ 200,000 202,600 - 312,471 316,533 113,153
Others 71,059 72,741 51,972 40,235
273,659 72,741 368,505 153,388
Foreign currency
notes and bonds
(including current portions) US$ 50,000 50,650 52,190 100,000 101,300 104,380
Long-term debt,
(including current maturities)
US$ 131,885 133,600 138,180 222,930 225,828 127,245
JPY 11,514,500 99,013 135,904 - - -
Others 172,903 109,770 - -
405,516 383,854 225,828 127,245
Total foreign
currency liabilities \6,911,526 \6,320,647 \
6,287,419 \5,053,608