Samsung 2005 Annual Report Download - page 137
Download and view the complete annual report
Please find page 137 of the 2005 Samsung annual report below. You can navigate through the pages in the report by either clicking on the pages listed below, or by using the keyword search tool below to find specific information within the annual report.-
 1
1 -
2
-
3
-
4
-
5
-
6
-
7
-
8
-
9
-
10
-
11
-
12
-
13
-
14
-
15
-
16
-
17
-
18
-
19
-
20
-
21
-
22
-
23
-
24
-
25
-
26
-
27
-
28
-
29
-
30
-
31
-
32
-
33
-
34
-
35
-
36
-
37
-
38
-
39
-
40
-
41
-
42
-
43
-
44
-
45
-
46
-
47
-
48
-
49
-
50
-
51
-
52
-
53
-
54
-
55
-
56
-
57
-
58
-
59
-
60
-
61
-
62
-
63
-
64
-
65
-
66
-
67
-
68
-
69
-
70
-
71
-
72
-
73
-
74
-
75
-
76
-
77
-
78
-
79
-
80
-
81
-
82
-
83
-
84
-
85
-
86
-
87
-
88
-
89
-
90
-
91
-
92
-
93
-
94
-
95
-
96
-
97
-
98
-
99
-
100
-
101
-
102
-
103
-
104
-
105
-
106
-
107
-
108
-
109
-
110
-
111
-
112
-
113
-
114
-
115
-
116
-
117
-
118
-
119
-
120
-
121
-
122
-
123
-
124
-
125
-
126
-
 127
127 -
 128
128 -
 129
129 -
 130
130 -
 131
131 -
 132
132 -
 133
133 -
 134
134 -
 135
135 -
 136
136 -
 137
137 -
 138
138 -
 139
139 -
 140
140 -
 141
141 -
 142
142 -
 143
143 -
 144
144 -
 145
145 -
 146
146 -
 147
147 -
148
 |
 |

135
\ \ \ \ \
\ \ \ \ \
\ \ \ \ \
\ \ \ \ \
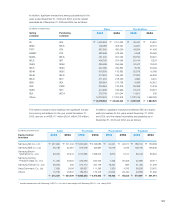
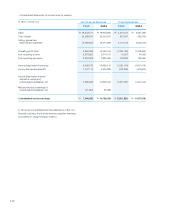
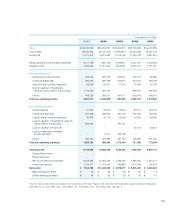
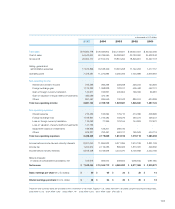
in thousands of U.S. dollars
2005 2004 2003 2002 2001
Sales $ 56,720,306 $ 55,256,337 $ 36,409,370 $ 33,759,636 $ 24,419,589
Cost of sales 39,642,794 35,742,748 24,660,612 22,454,888 18,487,732
Gross profit 17,077,512 19,513,589 11,748,758 11,304,748 5,931,857
Selling, general and administrative expenses 9,121,169 7,992,135 5,739,817 5,267,521 4,200,836
Operating profit 7,956,343 11,512,454 6,008,941 6,037,227 1,731,021
Non-operating income
Interest and dividend income 226,707 283,248 209,027 207,151 95,365
Foreign exchange gain 394,496 386,169 246,674 243,913 180,429
Gain on foreign currency translation 89,030 132,817 11,207 47,464 35,736
Gain on valuation of investments
using the equity method of accounting 1,116,500 553,138 - 889,810 591,848
Others 448,529 693,277 464,717 693,876 469,551
Total non-operating income 2,637,077 2,048,649 931,625 2,082,214 1,372,929
Non-operating expenses
Interest expense 41,672 63,250 79,913 83,751 154,709
Foreign exchange loss 344,328 349,825 297,216 185,754 183,196
Loss on foreign currency translation 30,843 40,175 28,556 14,623 68,999
Loss on valuation of investments using the
equity method of accounting 959,697 - 191,241 - -
Loss on valuation of inventories - - - 35,172 40,821
Loss on impairment of available-
for-sale securities - 9,747 283,748 - -
Others 460,244 523,668 291,730 408,086 331,484
Total non-operating expenses 1,836,784 986,665 1,172,404 727,386 779,209
Ordinary profit 8,756,636 12,583,438 5,768,162 7,392,055 2,324,741
Extraordinary income - - - - -
Extraordinary loss - - - - -
Net income before income taxes 8,756,636 12,583,438 5,768,162 7,392,055 2,324,741
Income tax expense 1,214,471 2,241,403 789,885 1,515,588 102,316
Net income $ 7,542,165 $ 10,342,035 $ 4,978,277 $ 5,876,467 $ 2,222,425
Basic earnings per share $ 49 $ 65 $ 30 $ 35 $ 13
Diluted earnings per share $ 48 $ 64 $ 30 $ 35 $ 13
These five-year summary tables are provided for the convenience of the reader. Figures in U.S. dollars have been calculated using the following exchange rates.
2005: KRW 1,013 2004: KRW 1,043 2003: KRW 1,197 2002: KRW 1,200 2001: KRW 1,326 (Per USD 1)