Samsung 2005 Annual Report Download - page 139
Download and view the complete annual report
Please find page 139 of the 2005 Samsung annual report below. You can navigate through the pages in the report by either clicking on the pages listed below, or by using the keyword search tool below to find specific information within the annual report.-
 1
1 -
2
-
3
-
4
-
5
-
6
-
7
-
8
-
9
-
10
-
11
-
12
-
13
-
14
-
15
-
16
-
17
-
18
-
19
-
20
-
21
-
22
-
23
-
24
-
25
-
26
-
27
-
28
-
29
-
30
-
31
-
32
-
33
-
34
-
35
-
36
-
37
-
38
-
39
-
40
-
41
-
42
-
43
-
44
-
45
-
46
-
47
-
48
-
49
-
50
-
51
-
52
-
53
-
54
-
55
-
56
-
57
-
58
-
59
-
60
-
61
-
62
-
63
-
64
-
65
-
66
-
67
-
68
-
69
-
70
-
71
-
72
-
73
-
74
-
75
-
76
-
77
-
78
-
79
-
80
-
81
-
82
-
83
-
84
-
85
-
86
-
87
-
88
-
89
-
90
-
91
-
92
-
93
-
94
-
95
-
96
-
97
-
98
-
99
-
100
-
101
-
102
-
103
-
104
-
105
-
106
-
107
-
108
-
109
-
110
-
111
-
112
-
113
-
114
-
115
-
116
-
117
-
118
-
119
-
120
-
121
-
122
-
123
-
124
-
125
-
126
-
127
-
128
-
 129
129 -
 130
130 -
 131
131 -
 132
132 -
 133
133 -
 134
134 -
 135
135 -
 136
136 -
 137
137 -
 138
138 -
 139
139 -
 140
140 -
 141
141 -
 142
142 -
 143
143 -
 144
144 -
 145
145 -
 146
146 -
 147
147 -
 148
148
 |
 |

137
\ \ \ \ \
\ \ \ \ \
\ \ \ \ \
\ \ \ \ \
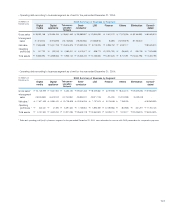
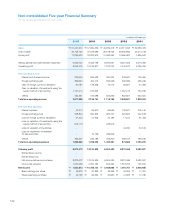
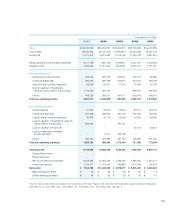
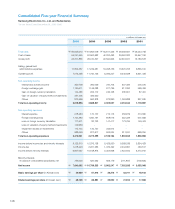
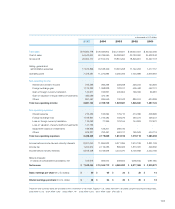
in thousands of U.S. dollars
2005 2004 2003 2002 2001
Total sales $ 79,594,778 $ 78,583,902 $ 54,149,921 $ 49,640,551 $ 35,025,466
Cost of sales 54,542,601 50,769,590 35,298,657 30,793,600 24,628,348
Gross profit 25,052,177 27,814,312 18,851,264 18,846,951 10,397,118
Selling, general and
administrative expenses 17,573,896 16,538,429 13,591,258 11,142,253 7,417,157
Operating profit 7,478,281 11,275,883 5,260,006 7,704,698 2,979,961
Non-operating income
Interest and dividend income 316,593 366,298 259,568 256,244 154,656
Foreign exchange gain 1,175,332 1,098,838 728,317 509,468 452,101
Gain on foreign currency translation 142,611 193,837 205,654 196,334 65,981
Gain on valuation of equity method investments 485,099 475,187 - - -
Others 861,467 635,549 730,042 886,574 624,386
Total non-operating income 2,981,102 2,769,709 1,923,581 1,846,620 1,297,124
Non-operating expenses
Interest expense 215,432 163,094 179,710 214,099 309,699
Foreign exchange loss 1,109,951 1,016,482 758,576 460,274 458,272
Loss on foreign currency translation 116,062 77,395 123,155 144,803 112,672
Loss on valuation of equity method investments 147,735 - - - -
Impairment losses on investments 169,936 129,201 288,734 - -
Others 679,227 793,497 462,017 759,943 504,716
Total non-operating expenses 2,438,343 2,179,669 1,812,192 1,579,119 1,385,359
Income before income tax and minority interests 8,021,040 11,865,923 5,371,395 7,974,199 2,891,726
Income tax 1,202,612 2,116,285 899,325 1,870,331 349,560
Income before minority interests 6,818,428 9,749,638 4,472,070 6,103,868 2,542,166
Minority interests
in losses of consolidated subsidiaries, net 723,618 595,074 508,922 (226,505) (238,194)
Net income $ 7,542,046 $ 10,344,712 $ 4,980,992 $ 5,877,363 $ 2,303,972
Basic earnings per share (in U.S. dollars) $ 49 $ 65 $ 30 $ 35 $ 14
Diluted earnings per share (in U.S. dollar) $ 48 $ 64 $ 30 $ 35 $ 13
These five-year summary tables are provided for the convenience of the reader. Figures in U.S. dollars have been calculated using the following exchange rates.
2005: KRW 1,013 2004: KRW 1,043 2003: KRW 1,197 2002: KRW 1,200 2001: KRW 1,326 (Per USD 1)