Samsung 2005 Annual Report Download - page 102
Download and view the complete annual report
Please find page 102 of the 2005 Samsung annual report below. You can navigate through the pages in the report by either clicking on the pages listed below, or by using the keyword search tool below to find specific information within the annual report.-
 1
1 -
2
-
3
-
4
-
5
-
6
-
7
-
8
-
9
-
10
-
11
-
12
-
13
-
14
-
15
-
16
-
17
-
18
-
19
-
20
-
21
-
22
-
23
-
24
-
25
-
26
-
27
-
28
-
29
-
30
-
31
-
32
-
33
-
34
-
35
-
36
-
37
-
38
-
39
-
40
-
41
-
42
-
43
-
44
-
45
-
46
-
47
-
48
-
49
-
50
-
51
-
52
-
53
-
54
-
55
-
56
-
57
-
58
-
59
-
60
-
61
-
62
-
63
-
64
-
65
-
66
-
67
-
68
-
69
-
70
-
71
-
72
-
73
-
74
-
75
-
76
-
77
-
78
-
79
-
80
-
81
-
82
-
83
-
84
-
85
-
86
-
87
-
88
-
89
-
90
-
91
-
 92
92 -
 93
93 -
 94
94 -
 95
95 -
 96
96 -
 97
97 -
 98
98 -
 99
99 -
 100
100 -
 101
101 -
 102
102 -
 103
103 -
 104
104 -
 105
105 -
 106
106 -
 107
107 -
 108
108 -
 109
109 -
 110
110 -
 111
111 -
 112
112 -
113
-
114
-
115
-
116
-
117
-
118
-
119
-
120
-
121
-
122
-
123
-
124
-
125
-
126
-
127
-
128
-
129
-
130
-
131
-
132
-
133
-
134
-
135
-
136
-
137
-
138
-
139
-
140
-
141
-
142
-
143
-
144
-
145
-
146
-
147
-
148
 |
 |
100
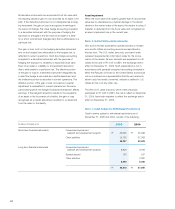
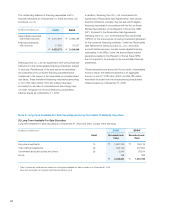
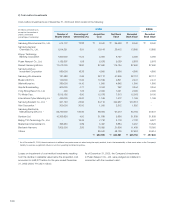
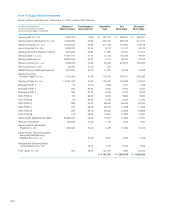
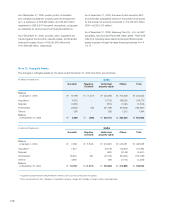
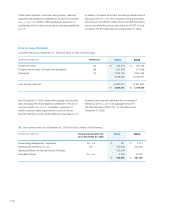
2) Cost-method investments
Cost-method investments as of December 31, 2005 and 2004 consist of the following:
1 As of December 31, 2005, these investments in affiliated companies were not valued using the equity method, due to the immateriality of their asset values or the Company’s
inability to exercise a significant influence over the operating and financial policies.
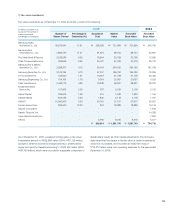
Losses on impairment of cost-method investments resulting
from the decline in realizable value below the acquisition cost
amounted to \68,272 million for the year ended December
31, 2005 (2004: \13,651 million).
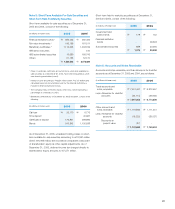
As of December 31, 2005, the Company’s investments
in Pusan Newport Co., Ltd. were pledged as collateral in
connection with the investee’s debt.
(in millions of Korean won,
except for the number of
shares owned and
percentage of ownership)
2005 2004
Number of
Shares Owned
Percentage of
Ownership (%)
Acquisition
Cost
Net Book
Value
Recorded
Book Value
Recorded
Book Value
Samsung Petrochemical Co., Ltd. 514,172 12.96 \8,040 \ 35,538 \8,040 \8,040
Samsung General
Chemicals Co., Ltd. 1,914,251 3.91 19,143 29,415 13,865 13,865
Kihyup Technology
Banking Corporation 1,000,000 17.24 5,000 6,157 5,000 5,000
Pusan Newport Co., Ltd. 1,135,307 1.59 5,676 5,039 5,676 5,676
Renault Samsung Motors 17,512,000 19.90 87,560 115,794 87,560 87,560
Samsung Venture
Investment Corporation 980,000 16.33 4,900 5,890 4,900 4,900
Samsung Life Insurance 131,588 0.66 92,112 51,909 92,112 92,112
Bluebird Soft Inc. 140,000 17.00 10,199 2,841 2,441 2,441
iMarketKorea Inc. 380,000 14.10 1,900 4,945 1,900 1,900
SkyLife Broadcasting 600,000 0.71 3,344 252 3,344 3,344
Yong Pyong Resort Co. Ltd. 400 1.05 2,000 1,021 2,000 2,000
TU Media Corp. 3,015,195 6.90 15,076 7,313 15,076 9,100
International Cyber Marketing, Inc 1450,000 45.00 1,166 1,472 1,166 1,166
Samsung Everland Co., Ltd. 1641,123 25.64 64,112 424,937 270,313 -
Allat Corporation 1300,000 30.00 1,500 2,312 1,892 -
Samsung Electronics
Manufacturing (UK) Ltd. 156,730,000 100.00 99,094 67,273 35,764 50,641
Symbian Ltd. 10,359,926 4.50 31,839 5,836 31,839 31,839
Beijing T3G Technology Co., Ltd. - 16.26 7,732 2,118 7,732 6,327
MasterCard International Inc. 363,630 0.89 5,467 3,884 5,467 13,320
Bad bank Harmony 7,805,500 2.85 78,055 21,906 11,439 78,055
Others 89,040 48,729 37,624 40,514
\632,955 \844,581 \645,150 \457,800