Samsung 2005 Annual Report Download - page 127
Download and view the complete annual report
Please find page 127 of the 2005 Samsung annual report below. You can navigate through the pages in the report by either clicking on the pages listed below, or by using the keyword search tool below to find specific information within the annual report.-
 1
1 -
2
-
3
-
4
-
5
-
6
-
7
-
8
-
9
-
10
-
11
-
12
-
13
-
14
-
15
-
16
-
17
-
18
-
19
-
20
-
21
-
22
-
23
-
24
-
25
-
26
-
27
-
28
-
29
-
30
-
31
-
32
-
33
-
34
-
35
-
36
-
37
-
38
-
39
-
40
-
41
-
42
-
43
-
44
-
45
-
46
-
47
-
48
-
49
-
50
-
51
-
52
-
53
-
54
-
55
-
56
-
57
-
58
-
59
-
60
-
61
-
62
-
63
-
64
-
65
-
66
-
67
-
68
-
69
-
70
-
71
-
72
-
73
-
74
-
75
-
76
-
77
-
78
-
79
-
80
-
81
-
82
-
83
-
84
-
85
-
86
-
87
-
88
-
89
-
90
-
91
-
92
-
93
-
94
-
95
-
96
-
97
-
98
-
99
-
100
-
101
-
102
-
103
-
104
-
105
-
106
-
107
-
108
-
109
-
110
-
111
-
112
-
113
-
114
-
115
-
116
-
 117
117 -
 118
118 -
 119
119 -
 120
120 -
 121
121 -
 122
122 -
 123
123 -
 124
124 -
 125
125 -
 126
126 -
 127
127 -
 128
128 -
 129
129 -
 130
130 -
 131
131 -
 132
132 -
 133
133 -
 134
134 -
 135
135 -
 136
136 -
 137
137 -
138
-
139
-
140
-
141
-
142
-
143
-
144
-
145
-
146
-
147
-
148
 |
 |
125
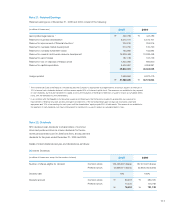
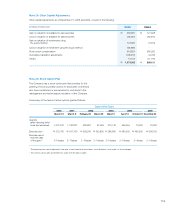
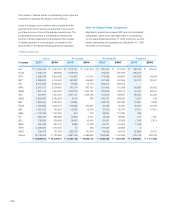
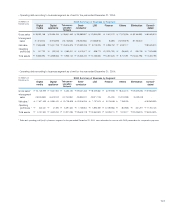
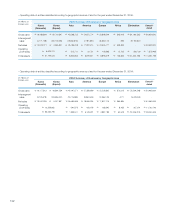
In addition, significant transactions among subsidiaries for the
years ended December 31, 2005 and 2004, and the related
receivables as of December 31, 2005 and 2004, are as follows:
(in millions of Korean won) Sales Receivables
Selling
company
Purchasing
company
2005 2004 2005 2004
SII SEA \1,676,658 \1,751,694 \26,437 \24,861
SESK SELS 709,088 458,527 44,287 48,710
TSTC STA 697,960 480,080 43,284 41,466
SSKMT STA 583,569 479,425 5,848 29,059
SDMA SELS 431,450 307,052 84,184 29,921
SELS SEF 406,793 224,585 20,414 8,224
SSEG SESK 365,489 264,654 34,447 19,343
SELS SESA 342,069 340,861 8,732 26,499
SEHK SESC 318,609 132,882 25,079 15,069
SEHK SELS 313,924 246,552 72,267 55,809
SELS SEO 311,455 218,430 4,690 6,261
SEIN SEA 296,924 214,763 6,086 42,812
SSS TSED 275,953 130,876 29,068 10,249
SSEC SEO 274,298 169,999 76,413 53,977
SEA SECA 275,745 261,044 11,551 335
Others 15,013,979 17,322,918 1,732,745 1,468,030
\22,293,963 \23,004,342 \2,225,532 \1,880,625
The related company loans resulting from significant transac-
tions among subsidiaries for the year ended December 31,
2005, amount to \638,117 million (2004: \604,319 million).
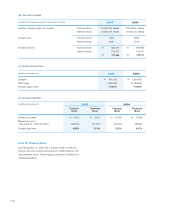
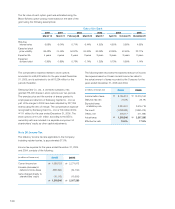
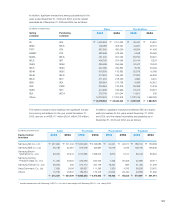
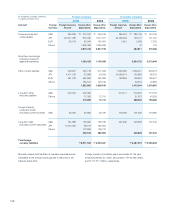
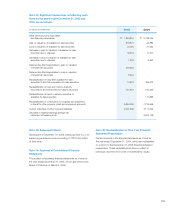
In addition, significant transactions between SEC and equity-
method investees for the years ended December 31, 2005
and 2004, and the related receivables and payables as of
December 31, 2005 and 2004, are as follows:
(in millions of Korean won) Sales Purchases Receivables Payables
Equity-method
investees
2005 2004 2005 2004 2005 2004 2005 2004
Samsung SDI Co., Ltd. 1\237,925 \371,432 \1,650,220 \2,129,086 \24,347 \29,517 \189,104 \156,396
Samsung SDS Co., Ltd. 36,739 52,381 619,709 542,967 10,079 3,195 128,190 128,648
Samsung Electro-
Mechanics Co., Ltd. 33,234 20,244 1,013,365 1,058,374 9,875 5,147 83,243 80,924
Samsung Corning
Precision Glass Co., Ltd. 11,255 33,534 544,036 534,004 1,455 26,458 42,680 39,411
Samsung Techwin Co., Ltd. 33,584 465 512,712 420,746 16,327 683 51,256 41,228
Seoul Commtech. Co., Ltd. 7,629 9,506 136,327 111,248 1,320 4,783 36,528 23,675
Others 15,185 46,847 189,484 176,218 27,003 26,440 43,896 31,632
\375,551 \534,409 \4,665,853 \4,972,643 \90,406 \96,223 \574,897 \501,914
1 Includes transactions with Samsung OLED Co., Ltd. which was merged with Samsung SDI Co., Ltd. during 2005.