Samsung 2005 Annual Report Download - page 101
Download and view the complete annual report
Please find page 101 of the 2005 Samsung annual report below. You can navigate through the pages in the report by either clicking on the pages listed below, or by using the keyword search tool below to find specific information within the annual report.-
 1
1 -
2
-
3
-
4
-
5
-
6
-
7
-
8
-
9
-
10
-
11
-
12
-
13
-
14
-
15
-
16
-
17
-
18
-
19
-
20
-
21
-
22
-
23
-
24
-
25
-
26
-
27
-
28
-
29
-
30
-
31
-
32
-
33
-
34
-
35
-
36
-
37
-
38
-
39
-
40
-
41
-
42
-
43
-
44
-
45
-
46
-
47
-
48
-
49
-
50
-
51
-
52
-
53
-
54
-
55
-
56
-
57
-
58
-
59
-
60
-
61
-
62
-
63
-
64
-
65
-
66
-
67
-
68
-
69
-
70
-
71
-
72
-
73
-
74
-
75
-
76
-
77
-
78
-
79
-
80
-
81
-
82
-
83
-
84
-
85
-
86
-
87
-
88
-
89
-
90
-
 91
91 -
 92
92 -
 93
93 -
 94
94 -
 95
95 -
 96
96 -
 97
97 -
 98
98 -
 99
99 -
 100
100 -
 101
101 -
 102
102 -
 103
103 -
 104
104 -
 105
105 -
 106
106 -
 107
107 -
 108
108 -
 109
109 -
 110
110 -
 111
111 -
112
-
113
-
114
-
115
-
116
-
117
-
118
-
119
-
120
-
121
-
122
-
123
-
124
-
125
-
126
-
127
-
128
-
129
-
130
-
131
-
132
-
133
-
134
-
135
-
136
-
137
-
138
-
139
-
140
-
141
-
142
-
143
-
144
-
145
-
146
-
147
-
148
 |
 |
99
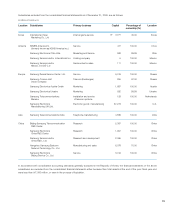
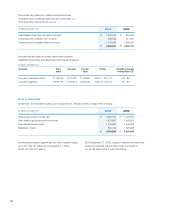
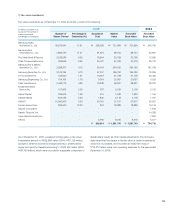
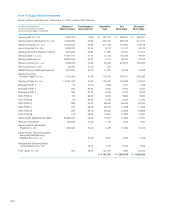
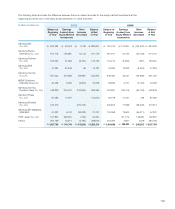
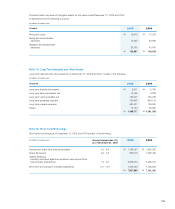
1) Fair-value investments
Fair-value investments as of December 31, 2005 and 2004, consist of the following:
(in millions of Korean won,
except for the number of
shares owned and
percentage of ownership)
2005 2004
Number of
Shares Owned
Percentage of
Ownership (%)
Acquisition
Cost
Market
Value
Recorded
Book Value
Recorded
Book Value
Samsung Heavy
Industries Co., Ltd. 40,675,641 17.61 \258,299 \ 721,993 \721,993 \262,765
Samsung Fine
Chemicals Co., Ltd. 2,969,730 11.51 61,375 98,744 98,744 52,861
The Shilla Hotel & Resorts 2,529,580 6.35 18,604 32,758 32,758 15,860
Cheil Communications Inc. 259,949 5.65 25,737 57,319 57,319 39,122
Samsung Fire & Marine
Insurance Co., Ltd. 2,298,377 4.70 90,443 294,192 294,192 187,318
Samsung Securities Co., Ltd. 3,143,194 4.70 57,347 195,192 195,192 78,894
S1 Corporation lnc. 725,060 1.91 16,207 31,758 31,758 26,465
Samsung Engineering Co., Ltd. 704,104 1.76 9,018 20,067 20,067 5,253
Cheil Industries lnc. 2,449,713 4.90 18,339 68,837 68,837 39,073
Korea Information
Service Inc. 107,603 2.26 797 2,109 2,109 2,120
Hanmi Capital 235,676 1.59 415 1,933 1,933 1,155
Saehan Media 973,738 2.33 1,840 2,118 2,118 1,197
SANYO 10,000,000 0.53 40,761 27,517 27,517 35,827
Tomen device Corp. 832,000 12.23 972 18,888 18,888 16,134
Dacom Corporation - - - - - 1,816
Hanaro Telecom, Inc. - - - - - 14,289
Hynix Semiconductor Inc. - - - - - 7,950
Others - 5,760 8,315 8,315 6,617
\605,914 \1,581,740 \1,581,740 \794,716
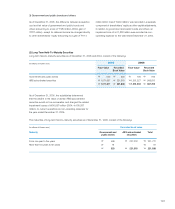
As of December 31, 2005, unrealized holding gains on fair-value
investments amount to \556,586 million (2004: \97,125 million),
except for deferred income tax charged directly to shareholders’
equity and minority interests amounting to \432,490 million (2004:
\60,769 million), which were recorded in a separate component of
shareholders’ equity as other capital adjustments. The Company
determined that the decline in the fair value of certain investments
would not recoverable, and recorded an impairment loss of
\13,316 million under non-operating expenses for the year ended
December 31, 2005.