Samsung 2005 Annual Report Download - page 74
Download and view the complete annual report
Please find page 74 of the 2005 Samsung annual report below. You can navigate through the pages in the report by either clicking on the pages listed below, or by using the keyword search tool below to find specific information within the annual report.-
 1
1 -
2
-
3
-
4
-
5
-
6
-
7
-
8
-
9
-
10
-
11
-
12
-
13
-
14
-
15
-
16
-
17
-
18
-
19
-
20
-
21
-
22
-
23
-
24
-
25
-
26
-
27
-
28
-
29
-
30
-
31
-
32
-
33
-
34
-
35
-
36
-
37
-
38
-
39
-
40
-
41
-
42
-
43
-
44
-
45
-
46
-
47
-
48
-
49
-
50
-
51
-
52
-
53
-
54
-
55
-
56
-
57
-
58
-
59
-
60
-
61
-
62
-
63
-
 64
64 -
 65
65 -
 66
66 -
 67
67 -
 68
68 -
 69
69 -
 70
70 -
 71
71 -
 72
72 -
 73
73 -
 74
74 -
 75
75 -
 76
76 -
 77
77 -
 78
78 -
 79
79 -
 80
80 -
 81
81 -
 82
82 -
 83
83 -
 84
84 -
85
-
86
-
87
-
88
-
89
-
90
-
91
-
92
-
93
-
94
-
95
-
96
-
97
-
98
-
99
-
100
-
101
-
102
-
103
-
104
-
105
-
106
-
107
-
108
-
109
-
110
-
111
-
112
-
113
-
114
-
115
-
116
-
117
-
118
-
119
-
120
-
121
-
122
-
123
-
124
-
125
-
126
-
127
-
128
-
129
-
130
-
131
-
132
-
133
-
134
-
135
-
136
-
137
-
138
-
139
-
140
-
141
-
142
-
143
-
144
-
145
-
146
-
147
-
148
 |
 |

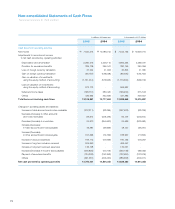
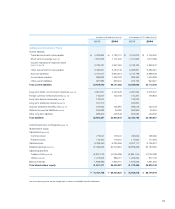
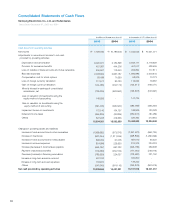
72
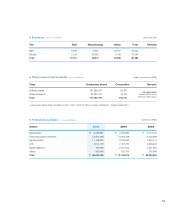
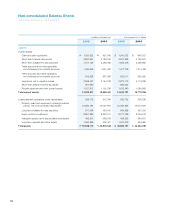
Non-consolidated Statements of Cash Flows
Years Ended December 31, 2005 and 2004
in millions of Korean won in thousands of U.S. dollars
2005 2004 2005 2004
Cash flows from operating activities
Net income \ 7,640,213 \
10,786,742 $ 7,542,165 $ 10,648,314
Adjustments to reconcile net income
to net cash provided by operating activities:
Depreciation and amortization 5,060,475 4,526,115 4,995,533 4,468,031
Provision for severance benefits 385,706 365,041 380,756 360,356
Loss on foreign currency translation 31,244 41,903 30,843 41,365
Gain on foreign currency translation (90,187) (138,528) (89,030) (136,750)
Gain on valuation of investments
using the equity method of accounting (1,131,014) (576,923) (1,116,500) (569,519)
Loss on valuation on investments
using the equity method of accounting 972,173 - 959,697 -
Deferred income taxes (198,751) 380,425 (196,200) 375,543
Others 436,992 332,829 431,385 328,557
Total items not involving cash flows 13,106,851 15,717,604 12,938,649 15,515,897
Changes in operating assets and liabilities:
Increase in trade accounts and notes receivable (372,311) (83,295) (367,533) (82,226)
Decrease (Increase) in other accounts
and notes receivable 93,912 (228,436) 92,707 (225,504)
Decrease (Increase) in inventories 24,910 (854,560) 24,590 (843,593)
Increase (Decrease)
in trade accounts and notes payable 49,381 (33,669) 48,747 (33,237)
Increase (Decrease)
in other accounts and notes payable 191,393 (72,759) 188,937 (71,825)
Increase in accrued expenses 183,115 279,889 180,765 276,297
Increase in long-term advance received 505,950 - 499,457 -
Increase in long-term accrued expenses 133,748 - 132,031 -
Increase (Decrease) in income taxes payable (600,859) 475,180 (593,148) 469,082
Payment of severance benefits (134,308) (190,359) (132,584) (187,916)
Others (391,381) (205,250) (386,358) (202,617)
Net cash provided by operating activities 12,790,401 14,804,345 12,626,260 14,614,358