Samsung 2005 Annual Report Download - page 75
Download and view the complete annual report
Please find page 75 of the 2005 Samsung annual report below. You can navigate through the pages in the report by either clicking on the pages listed below, or by using the keyword search tool below to find specific information within the annual report.-
 1
1 -
2
-
3
-
4
-
5
-
6
-
7
-
8
-
9
-
10
-
11
-
12
-
13
-
14
-
15
-
16
-
17
-
18
-
19
-
20
-
21
-
22
-
23
-
24
-
25
-
26
-
27
-
28
-
29
-
30
-
31
-
32
-
33
-
34
-
35
-
36
-
37
-
38
-
39
-
40
-
41
-
42
-
43
-
44
-
45
-
46
-
47
-
48
-
49
-
50
-
51
-
52
-
53
-
54
-
55
-
56
-
57
-
58
-
59
-
60
-
61
-
62
-
63
-
64
-
 65
65 -
 66
66 -
 67
67 -
 68
68 -
 69
69 -
 70
70 -
 71
71 -
 72
72 -
 73
73 -
 74
74 -
 75
75 -
 76
76 -
 77
77 -
 78
78 -
 79
79 -
 80
80 -
 81
81 -
 82
82 -
 83
83 -
 84
84 -
 85
85 -
86
-
87
-
88
-
89
-
90
-
91
-
92
-
93
-
94
-
95
-
96
-
97
-
98
-
99
-
100
-
101
-
102
-
103
-
104
-
105
-
106
-
107
-
108
-
109
-
110
-
111
-
112
-
113
-
114
-
115
-
116
-
117
-
118
-
119
-
120
-
121
-
122
-
123
-
124
-
125
-
126
-
127
-
128
-
129
-
130
-
131
-
132
-
133
-
134
-
135
-
136
-
137
-
138
-
139
-
140
-
141
-
142
-
143
-
144
-
145
-
146
-
147
-
148
 |
 |
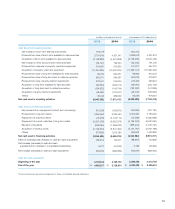
73
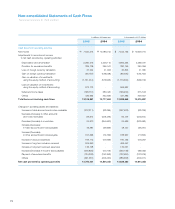
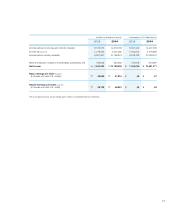
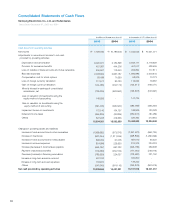
in millions of Korean won in thousands of U.S. dollars
2005 2004 2005 2004
Cash flows from investing activities
Disposal of short-term financial instruments \288,775 \ 60,130 $ 285,069 $ 59,358
Proceeds from disposal of short-term
available-for-sale securities 3,574,058 2,518,498 3,528,192 2,486,178
Acquisition of short-term
available-for-sale securities (3,172,410) (2,292,871) (3,131,698) (2,263,446)
Proceeds from disposal of property,
plant and equipment 174,321 520,865 172,084 514,181
Acquisition of property, plant and equipment (10,080,695) (7,869,985) (9,951,328) (7,768,988)
Proceeds from long-term
available-for-sale securities 21,574 102,667 21,297 101,349
Proceeds from disposal of investments 396,510 300,840 391,422 296,979
Acquisition of long-term
available-for-sale securities (30,074) (23,083) (29,688) (22,787)
Acquisition of equity-method investments (866,665) (1,980,439) (855,543) (1,955,024)
Others (250,658) (128,280) (247,442) (126,633)
Net cash used in investing activities (9,945,264) (8,791,658) (9,817,635) (8,678,833)
Cash flows from financing activities
Repayment of current portion of long-term debt - (1,001,207) - (988,358)
Payment of dividends (849,363) (1,596,281) (838,463) (1,575,796)
Acquisition of treasury stock (2,149,370) (3,841,485) (2,121,786) (3,792,187)
Exercise of stock options 249,329 115,924 246,129 114,436
Others - (28) - (27)
Net cash used in financing activities (2,749,404) (6,323,077) (2,714,120) (6,241,932)
Net decrease in cash and cash equivalents 95,733 (310,390) 94,505 (306,407)
Beginning of the year 957,819 1,268,209 945,527 1,251,934
End of the year \1,053,552 \957,819 $ 1,040,032 $ 945,527