Samsung 2005 Annual Report Download - page 108
Download and view the complete annual report
Please find page 108 of the 2005 Samsung annual report below. You can navigate through the pages in the report by either clicking on the pages listed below, or by using the keyword search tool below to find specific information within the annual report.-
 1
1 -
2
-
3
-
4
-
5
-
6
-
7
-
8
-
9
-
10
-
11
-
12
-
13
-
14
-
15
-
16
-
17
-
18
-
19
-
20
-
21
-
22
-
23
-
24
-
25
-
26
-
27
-
28
-
29
-
30
-
31
-
32
-
33
-
34
-
35
-
36
-
37
-
38
-
39
-
40
-
41
-
42
-
43
-
44
-
45
-
46
-
47
-
48
-
49
-
50
-
51
-
52
-
53
-
54
-
55
-
56
-
57
-
58
-
59
-
60
-
61
-
62
-
63
-
64
-
65
-
66
-
67
-
68
-
69
-
70
-
71
-
72
-
73
-
74
-
75
-
76
-
77
-
78
-
79
-
80
-
81
-
82
-
83
-
84
-
85
-
86
-
87
-
88
-
89
-
90
-
91
-
92
-
93
-
94
-
95
-
96
-
97
-
 98
98 -
 99
99 -
 100
100 -
 101
101 -
 102
102 -
 103
103 -
 104
104 -
 105
105 -
 106
106 -
 107
107 -
 108
108 -
 109
109 -
 110
110 -
 111
111 -
 112
112 -
 113
113 -
 114
114 -
 115
115 -
 116
116 -
 117
117 -
 118
118 -
119
-
120
-
121
-
122
-
123
-
124
-
125
-
126
-
127
-
128
-
129
-
130
-
131
-
132
-
133
-
134
-
135
-
136
-
137
-
138
-
139
-
140
-
141
-
142
-
143
-
144
-
145
-
146
-
147
-
148
 |
 |
106
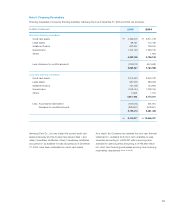
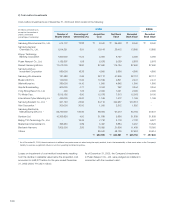
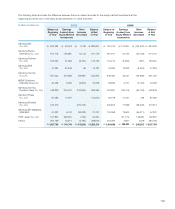
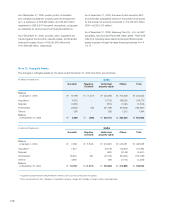
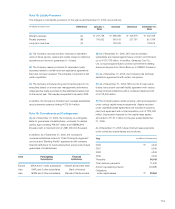
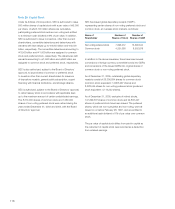
Financial information of investee companies as of December 31, 2005 and 2004, follows:
(in millions of Korean won) 2005 2004
Assets Liabilities Sales Net
income
(Loss)
Assets Liabilities Sales Net
income
(Loss)
Samsung SDI Co., Ltd. \ 5,729,771 \ 1,157,894 \ 5,718,899 \ 240,074 \ 5,664,486 \ 1,354,444 \ 6,121,777 \ 741,749
Samsung Electro-
Mechanics Co., Ltd. 2,774,120 1,098,202 2,231,204 (67,291) 2,612,592 968,552 2,687,444 91,148
Samsung Techwin
Co., Ltd. 1,624,359 912,420 2,391,351 86,444 1,737,985 1,088,296 1,980,552 25,826
Samsung SDS Co., Ltd. 953,142 472,665 1,875,222 147,796 776,106 443,464 1,768,630 79,991
Samsung Corning Co, Ltd. 700,016 139,356 615,051 (144,706) 982,430 193,530 850,375 107,323
MEMC Electronic
Materials Korea, Inc. 220,465 32,218 204,984 33,908 235,006 32,667 216,169 28,462
Samsung Corning
Precision Glass Co., Ltd. 1,997,442 459,687 1,702,944 780,015 1,634,358 556,618 1,254,511 599,021
Samsung Thales Co., Ltd. 348,684 138,967 452,665 27,265 385,628 203,176 409,299 (5,164)
Samsung Everland
Co., Ltd. - - - - 3,292,149 1,602,935 1,164,937 82,289
Samsung SDI (Malaysia)
SDN BHD 202,169 74,008 408,531 39,541 387,373 87,819 643,200 83,092
TSST Japan Co., Ltd. 358,492 342,997 1,466,305 (92,964) 524,424 424,300 1,259,872 (62,201)
Others 998,364 342,055 1,173,974 49,659 958,557 346,694 1,227,513 46,867
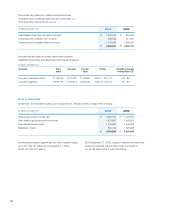
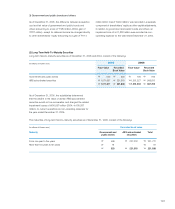
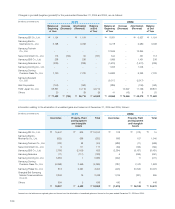
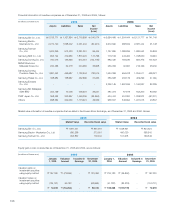
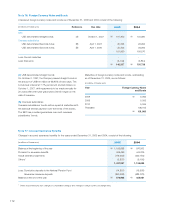
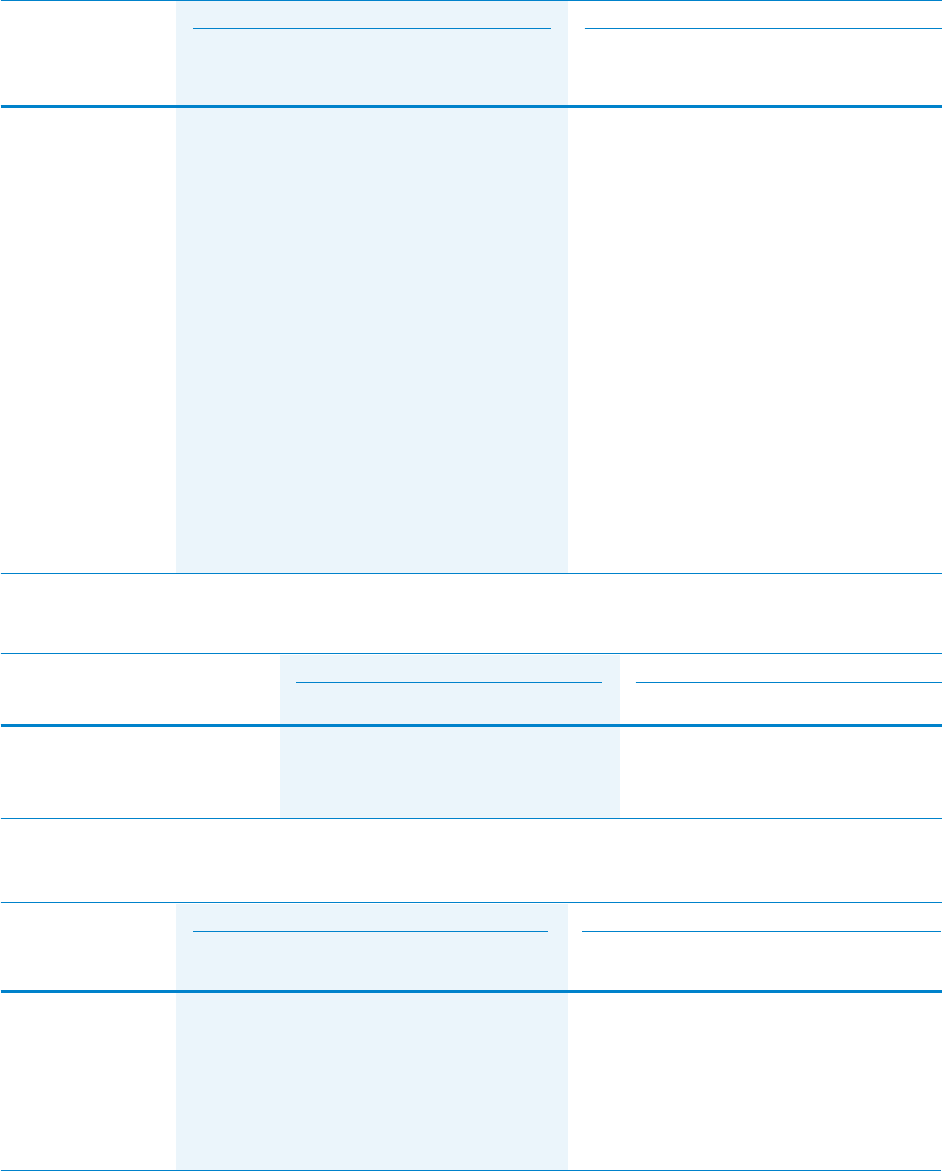
Equity gain or loss on securities as of December 31, 2005 and 2004, are as follows:
(in millions of Korean won) 2005 2004
January
1, 2005
Valuation
Amount
Included in
Earnings
December
31, 2005
January 1,
2004
Valuation
Amount
Included in
Earnings
December
31, 2005
Valuation gains on
investment securities
using equity method \197,320 \(73,936) - \123,384 \234,180 \(36,860) - \197,320
Valuation losses on
investment securities
using equity method (124,701) 60,732 - (63,969) (41,782) (82,919) - (124,701)
\72,619 \(13,204) -\59,415 \192,398 \(119,779) - \72,619
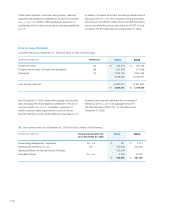
2005 2004
Market Value Recorded book value Market Value Recorded book value
Samsung SDI Co., Ltd. \ 1,081,441 \ 897,461 \ 1,048,951 \ 824,324
Samsung Electro- Mechanics Co., Ltd. 680,299 373,051 460,020 368,342
Samsung Techwin Co., Ltd. 353,857 179,044 157,618 163,546
Market value information of investee companies that are listed in the Korean Stock Exchange, as of December 31, 2005 and 2004, follows: