Samsung 2005 Annual Report Download - page 70
Download and view the complete annual report
Please find page 70 of the 2005 Samsung annual report below. You can navigate through the pages in the report by either clicking on the pages listed below, or by using the keyword search tool below to find specific information within the annual report.-
 1
1 -
2
-
3
-
4
-
5
-
6
-
7
-
8
-
9
-
10
-
11
-
12
-
13
-
14
-
15
-
16
-
17
-
18
-
19
-
20
-
21
-
22
-
23
-
24
-
25
-
26
-
27
-
28
-
29
-
30
-
31
-
32
-
33
-
34
-
35
-
36
-
37
-
38
-
39
-
40
-
41
-
42
-
43
-
44
-
45
-
46
-
47
-
48
-
49
-
50
-
51
-
52
-
53
-
54
-
55
-
56
-
57
-
58
-
59
-
 60
60 -
 61
61 -
 62
62 -
 63
63 -
 64
64 -
 65
65 -
 66
66 -
 67
67 -
 68
68 -
 69
69 -
 70
70 -
 71
71 -
 72
72 -
 73
73 -
 74
74 -
 75
75 -
 76
76 -
 77
77 -
 78
78 -
 79
79 -
 80
80 -
81
-
82
-
83
-
84
-
85
-
86
-
87
-
88
-
89
-
90
-
91
-
92
-
93
-
94
-
95
-
96
-
97
-
98
-
99
-
100
-
101
-
102
-
103
-
104
-
105
-
106
-
107
-
108
-
109
-
110
-
111
-
112
-
113
-
114
-
115
-
116
-
117
-
118
-
119
-
120
-
121
-
122
-
123
-
124
-
125
-
126
-
127
-
128
-
129
-
130
-
131
-
132
-
133
-
134
-
135
-
136
-
137
-
138
-
139
-
140
-
141
-
142
-
143
-
144
-
145
-
146
-
147
-
148
 |
 |
68
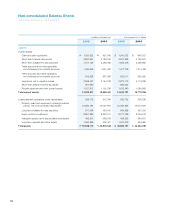
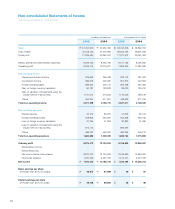
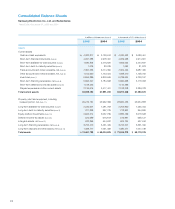
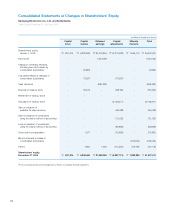
Non-consolidated Balance Sheets
Years Ended December 31, 2005 and 2004
in millions of Korean won in thousands of U.S. dollars
2005 2004 2005 2004
ASSETS
Current assets
Cash and cash equivalents \ 1,053,552 \ 957,819 $ 1,040,032 $ 945,527
Short-term financial instruments 3,897,931 4,186,706 3,847,908 4,132,977
Short-term available-for-sale securities 1,917,122 2,289,365 1,892,519 2,259,985
Trade accounts and notes receivable,
net of allowance for doubtful accounts 1,496,939 1,331,587 1,477,729 1,314,499
Other accounts and notes receivable,
net of allowance for doubtful accounts 842,828
937,658 832,011 925,625
Inventories, net to valuation losses 2,909,447 3,154,318 2,872,110 3,113,838
Short-term deferred income tax assets 907,680 - 896,032 -
Prepaid expenses and other current assets 1,197,812 1,101,038 1,182,440 1,086,908
Total current assets 14,223,311 13,958,491 14,040,781 13,779,359
Lease payment receivables under capital lease 269,179 312,034 265,725 308,030
Property, plant and equipment, including revalued
portion, net of accumulated depreciation 24,650,194 19,727,807 24,333,854 19,474,637
Long-term available-for-sale securities 977,409 463,197 964,866 457,253
Equity-method investments 8,891,880 8,353,211 8,777,769 8,246,013
Intangible assets, net of accumulated amortization 465,801 399,376 459,823 394,251
Long-term deposits and other assets 1,060,996 602,427 1,047,379 594,695
Total assets \50,538,770 \43,816,543 $49,890,197 $43,254,238