Samsung 2005 Annual Report Download - page 82
Download and view the complete annual report
Please find page 82 of the 2005 Samsung annual report below. You can navigate through the pages in the report by either clicking on the pages listed below, or by using the keyword search tool below to find specific information within the annual report.-
 1
1 -
2
-
3
-
4
-
5
-
6
-
7
-
8
-
9
-
10
-
11
-
12
-
13
-
14
-
15
-
16
-
17
-
18
-
19
-
20
-
21
-
22
-
23
-
24
-
25
-
26
-
27
-
28
-
29
-
30
-
31
-
32
-
33
-
34
-
35
-
36
-
37
-
38
-
39
-
40
-
41
-
42
-
43
-
44
-
45
-
46
-
47
-
48
-
49
-
50
-
51
-
52
-
53
-
54
-
55
-
56
-
57
-
58
-
59
-
60
-
61
-
62
-
63
-
64
-
65
-
66
-
67
-
68
-
69
-
70
-
71
-
 72
72 -
 73
73 -
 74
74 -
 75
75 -
 76
76 -
 77
77 -
 78
78 -
 79
79 -
 80
80 -
 81
81 -
 82
82 -
 83
83 -
 84
84 -
 85
85 -
 86
86 -
 87
87 -
 88
88 -
 89
89 -
 90
90 -
 91
91 -
 92
92 -
93
-
94
-
95
-
96
-
97
-
98
-
99
-
100
-
101
-
102
-
103
-
104
-
105
-
106
-
107
-
108
-
109
-
110
-
111
-
112
-
113
-
114
-
115
-
116
-
117
-
118
-
119
-
120
-
121
-
122
-
123
-
124
-
125
-
126
-
127
-
128
-
129
-
130
-
131
-
132
-
133
-
134
-
135
-
136
-
137
-
138
-
139
-
140
-
141
-
142
-
143
-
144
-
145
-
146
-
147
-
148
 |
 |

80
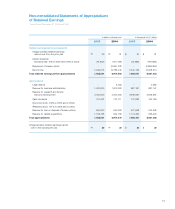
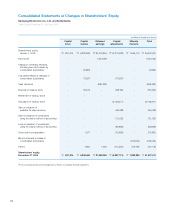
Consolidated Statements of Changes in Shareholders’ Equity
Samsung Electronics Co., Ltd. and Subsidiaries
Years Ended December 31, 2005 and 2004
The accompanying notes are an integral part of these consolidated financial statements.
in millions of Korean won (note 3)
Capital
stock
Capital
surplus
Retained
earnings
Capital
adjustments
Minority
interests
Total
Shareholders’ equity,
January 1, 2004 \895,241 \6,242,269 \24,415,681 \(2,062,601) \669,122 \30,159,712
Net income - - 10,789,535 - - 10,789,535
Conversion of convertible bonds 2,273 46,995 - - - 49,268
Change in ownership interests,
including new stock issues by
consolidated subsidiaries - (155,412) - - - (155,412)
Cumulative effects of changes of
consolidated subsidiaries - - - (65) 630,004 629,939
Cash dividends - - (1,596,282) - - (1,596,282)
Disposal of treasury stock - 45,535 - 114,551 - 160,086
Retirement of treasury stock - - (3,025,129) 3,025,129 - -
Acquisition of treasury stock - - - (3,841,485) - (3,841,485)
Loss on valuation of
available-for-sale securities - - - (22,675) - (22,675)
Gain on valuation of investments
using the equity method of accounting - - - (119,779) - (119,779)
Stock option compensation - 20,318 - (12,024) - 8,294
Minority interests in losses of
consolidated subsidiaries - - - - (620,662) (620,662)
Others - 39,881 (6,851) (351,539) 1,278,251 959,742
Shareholders’ equity,
December 31, 2004 \897,514 \6,239,586 \30,576,954 \(3,270,488) \1,956,715 \36,400,281