Samsung 2005 Annual Report Download - page 72
Download and view the complete annual report
Please find page 72 of the 2005 Samsung annual report below. You can navigate through the pages in the report by either clicking on the pages listed below, or by using the keyword search tool below to find specific information within the annual report.-
 1
1 -
2
-
3
-
4
-
5
-
6
-
7
-
8
-
9
-
10
-
11
-
12
-
13
-
14
-
15
-
16
-
17
-
18
-
19
-
20
-
21
-
22
-
23
-
24
-
25
-
26
-
27
-
28
-
29
-
30
-
31
-
32
-
33
-
34
-
35
-
36
-
37
-
38
-
39
-
40
-
41
-
42
-
43
-
44
-
45
-
46
-
47
-
48
-
49
-
50
-
51
-
52
-
53
-
54
-
55
-
56
-
57
-
58
-
59
-
60
-
61
-
 62
62 -
 63
63 -
 64
64 -
 65
65 -
 66
66 -
 67
67 -
 68
68 -
 69
69 -
 70
70 -
 71
71 -
 72
72 -
 73
73 -
 74
74 -
 75
75 -
 76
76 -
 77
77 -
 78
78 -
 79
79 -
 80
80 -
 81
81 -
 82
82 -
83
-
84
-
85
-
86
-
87
-
88
-
89
-
90
-
91
-
92
-
93
-
94
-
95
-
96
-
97
-
98
-
99
-
100
-
101
-
102
-
103
-
104
-
105
-
106
-
107
-
108
-
109
-
110
-
111
-
112
-
113
-
114
-
115
-
116
-
117
-
118
-
119
-
120
-
121
-
122
-
123
-
124
-
125
-
126
-
127
-
128
-
129
-
130
-
131
-
132
-
133
-
134
-
135
-
136
-
137
-
138
-
139
-
140
-
141
-
142
-
143
-
144
-
145
-
146
-
147
-
148
 |
 |

70
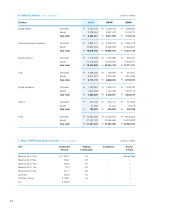
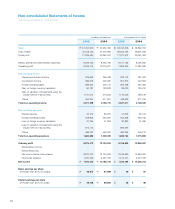
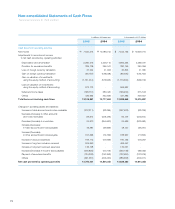
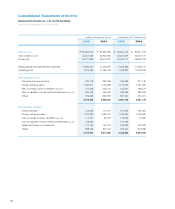
Non-consolidated Statements of Income
Years Ended December 31, 2005 and 2004
in millions of Korean won in thousands of U.S. dollars
2005 2004 2005 2004
Sales \ 57,457,670 \ 57,632,359 $ 56,720,306 $ 56,892,753
Cost of sales 40,158,150 37,279,686 39,642,794 36,801,269
Gross profit 17,299,520 20,352,673 17,077,512 20,091,484
Selling, general and administrative expenses 9,239,745 8,335,796 9,121,169 8,228,822
Operating profit 8,059,775 12,016,877 7,956,343 11,862,662
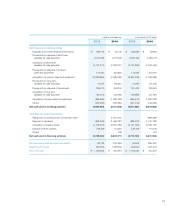
Non-operating income
Interest and dividend income 229,654 295,428 226,707 291,637
Commission income 366,519 205,287 361,815 202,653
Foreign exchange gains 399,624 402,774 394,496 397,605
Gain on foreign currency translation 90,187 138,528 89,030 136,750
Gain on valuation of investments using the
equity method of accounting 1,131,014 576,923 1,116,500 569,519
Others 454,361 517,801 448,529 511,156
Total non-operating income 2,671,359 2,136,741 2,637,077 2,109,320
Non-operating expenses
Interest expense 42,214 65,970 41,672 65,123
Foreign exchange losses 348,804 364,867 344,328 360,185
Loss on foreign currency translation 31,244 41,903 30,843 41,365
Loss on valuation of investments using the
equity method of accounting 972,173 - 959,697 -
Others 466,227 556,352 460,244 549,212
Total non-operating expenses 1,860,662 1,029,092 1,836,784 1,015,885
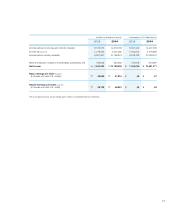
Ordinary profit 8,870,472 13,124,526 8,756,636 12,956,097
Extraordinary income - - - -
Extraordinary loss - - - -
Net income before income taxes 8,870,472 13,124,526 8,756,636 12,956,097
Income tax expense 1,230,259 2,337,784 1,214,471 2,307,783
Net income \7,640,213 \10,786,742 $7,542,165 $10,648,314
Basic earnings per share
(in Korean won and U.S. dollars) \49,970 \67,899 $49 $67
Diluted earnings per share
(in Korean won and U.S. dollar) \49,128 \66,864 $48 $66