Samsung 2005 Annual Report Download - page 131
Download and view the complete annual report
Please find page 131 of the 2005 Samsung annual report below. You can navigate through the pages in the report by either clicking on the pages listed below, or by using the keyword search tool below to find specific information within the annual report.-
 1
1 -
2
-
3
-
4
-
5
-
6
-
7
-
8
-
9
-
10
-
11
-
12
-
13
-
14
-
15
-
16
-
17
-
18
-
19
-
20
-
21
-
22
-
23
-
24
-
25
-
26
-
27
-
28
-
29
-
30
-
31
-
32
-
33
-
34
-
35
-
36
-
37
-
38
-
39
-
40
-
41
-
42
-
43
-
44
-
45
-
46
-
47
-
48
-
49
-
50
-
51
-
52
-
53
-
54
-
55
-
56
-
57
-
58
-
59
-
60
-
61
-
62
-
63
-
64
-
65
-
66
-
67
-
68
-
69
-
70
-
71
-
72
-
73
-
74
-
75
-
76
-
77
-
78
-
79
-
80
-
81
-
82
-
83
-
84
-
85
-
86
-
87
-
88
-
89
-
90
-
91
-
92
-
93
-
94
-
95
-
96
-
97
-
98
-
99
-
100
-
101
-
102
-
103
-
104
-
105
-
106
-
107
-
108
-
109
-
110
-
111
-
112
-
113
-
114
-
115
-
116
-
117
-
118
-
119
-
120
-
 121
121 -
 122
122 -
 123
123 -
 124
124 -
 125
125 -
 126
126 -
 127
127 -
 128
128 -
 129
129 -
 130
130 -
 131
131 -
 132
132 -
 133
133 -
 134
134 -
 135
135 -
 136
136 -
 137
137 -
 138
138 -
 139
139 -
 140
140 -
 141
141 -
142
-
143
-
144
-
145
-
146
-
147
-
148
 |
 |
129
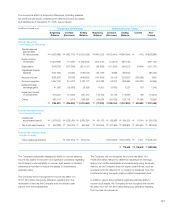
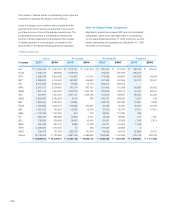
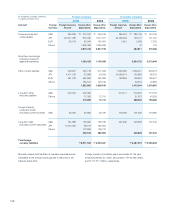
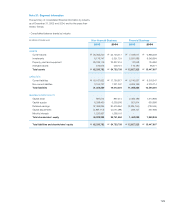
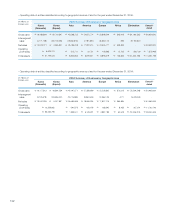
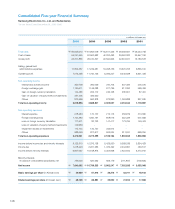
Note 31: Segment Information
The summary of consolidated financial information by industry
as of December 31, 2005 and 2004, and for the years then
ended, follows:
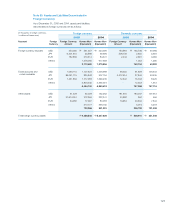
- Consolidated balance sheets by industry
(in millions of Korean won) Non-financial Business Financial Business
2005 2004 2005 2004
ASSETS
Current assets \26,365,240 \25,126,417 \7,033,011 \6,866,558
Investments 6,179,747 5,351,724 5,591,086 8,349,994
Property, plant and equipment 29,189,119 23,827,416 87,048 134,984
Intangible assets 516,676 448,151 116,180 96,371
Total assets \62,250,782 \54,753,708 \ 12,827,325 \15,447,907
LIABILITIES
Current liabilities \18,167,652 \17,790,977 \6,740,037 \8,318,347
Non-current liabilities 3,154,737 1,221,047 4,625,199 5,275,714
Total liabilities 21,322,389 19,012,024 11,365,236 13,594,061
SHAREHOLDERS' EQUITY
Capital stock 897,514 897,514 2,482,189 1,314,886
Capital surplus 6,338,460 6,239,586 921,914 930,998
Retained earnings 37,369,265 30,576,954 (2,235,155) (729,944)
Capital adjustments (4,897,713) (3,270,488) 293,141 337,906
Minority interests 1,220,867 1,298,118 - -
Total shareholders’ equity 40,928,393 35,741,684 1,462,089 1,853,846
Total liabilities and shareholders’ equity \62,250,782 \54,753,708 \12,827,325 \15,447,907