Samsung 2005 Annual Report Download - page 3
Download and view the complete annual report
Please find page 3 of the 2005 Samsung annual report below. You can navigate through the pages in the report by either clicking on the pages listed below, or by using the keyword search tool below to find specific information within the annual report.-
 1
1 -
 2
2 -
 3
3 -
 4
4 -
 5
5 -
 6
6 -
 7
7 -
 8
8 -
 9
9 -
 10
10 -
 11
11 -
 12
12 -
 13
13 -
 14
14 -
15
-
16
-
17
-
18
-
19
-
20
-
21
-
22
-
23
-
24
-
25
-
26
-
27
-
28
-
29
-
30
-
31
-
32
-
33
-
34
-
35
-
36
-
37
-
38
-
39
-
40
-
41
-
42
-
43
-
44
-
45
-
46
-
47
-
48
-
49
-
50
-
51
-
52
-
53
-
54
-
55
-
56
-
57
-
58
-
59
-
60
-
61
-
62
-
63
-
64
-
65
-
66
-
67
-
68
-
69
-
70
-
71
-
72
-
73
-
74
-
75
-
76
-
77
-
78
-
79
-
80
-
81
-
82
-
83
-
84
-
85
-
86
-
87
-
88
-
89
-
90
-
91
-
92
-
93
-
94
-
95
-
96
-
97
-
98
-
99
-
100
-
101
-
102
-
103
-
104
-
105
-
106
-
107
-
108
-
109
-
110
-
111
-
112
-
113
-
114
-
115
-
116
-
117
-
118
-
119
-
120
-
121
-
122
-
123
-
124
-
125
-
126
-
127
-
128
-
129
-
130
-
131
-
132
-
133
-
134
-
135
-
136
-
137
-
138
-
139
-
140
-
141
-
142
-
143
-
144
-
145
-
146
-
147
-
148
 |
 |
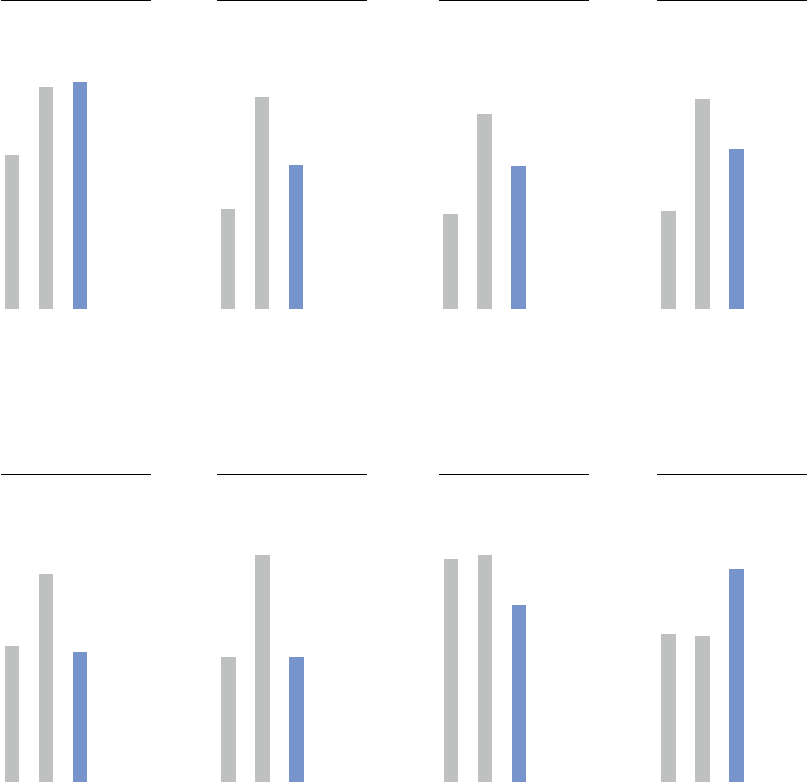
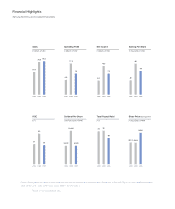
Financial Highlights
Based on non-consolidated data.
*
Samsung Electronics and Consolidated Subsidiaries
2003
Sales
in billions of USD
2004 2005
78.5 79.5
54.1
Earning Per Share
2003 2004 2005
65
49
30
in thousands of USD
2003 2004 2005
11.3
7.5
5.3
Operating Profit
in billions of USD
2003 2004 2005
Net Income
10.3
7.5
5.0
in billions of USD
32
20
2003 2004 2005
21
ROE
in %
2003 2004 2005
10,000
5,5005,500
Dividend Per Share
common stock, in KRW
2003 2004 2005
450.5
659.0
451.0
Share Price(Closing price)
in thousands of KRW
Total Payout Ratio
2003 2004 2005
50
39
49
in %
*
Data for these graphs are based on each fiscal year business performance and exchange rates. Please refer to the Audit Report for more detailed information.
2005: KRW 1,013 2004: KRW 1,043 2003: KRW 1,197 (Per USD 1)