Samsung 2005 Annual Report Download - page 104
Download and view the complete annual report
Please find page 104 of the 2005 Samsung annual report below. You can navigate through the pages in the report by either clicking on the pages listed below, or by using the keyword search tool below to find specific information within the annual report.-
 1
1 -
2
-
3
-
4
-
5
-
6
-
7
-
8
-
9
-
10
-
11
-
12
-
13
-
14
-
15
-
16
-
17
-
18
-
19
-
20
-
21
-
22
-
23
-
24
-
25
-
26
-
27
-
28
-
29
-
30
-
31
-
32
-
33
-
34
-
35
-
36
-
37
-
38
-
39
-
40
-
41
-
42
-
43
-
44
-
45
-
46
-
47
-
48
-
49
-
50
-
51
-
52
-
53
-
54
-
55
-
56
-
57
-
58
-
59
-
60
-
61
-
62
-
63
-
64
-
65
-
66
-
67
-
68
-
69
-
70
-
71
-
72
-
73
-
74
-
75
-
76
-
77
-
78
-
79
-
80
-
81
-
82
-
83
-
84
-
85
-
86
-
87
-
88
-
89
-
90
-
91
-
92
-
93
-
 94
94 -
 95
95 -
 96
96 -
 97
97 -
 98
98 -
 99
99 -
 100
100 -
 101
101 -
 102
102 -
 103
103 -
 104
104 -
 105
105 -
 106
106 -
 107
107 -
 108
108 -
 109
109 -
 110
110 -
 111
111 -
 112
112 -
 113
113 -
 114
114 -
115
-
116
-
117
-
118
-
119
-
120
-
121
-
122
-
123
-
124
-
125
-
126
-
127
-
128
-
129
-
130
-
131
-
132
-
133
-
134
-
135
-
136
-
137
-
138
-
139
-
140
-
141
-
142
-
143
-
144
-
145
-
146
-
147
-
148
 |
 |

102
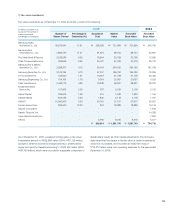
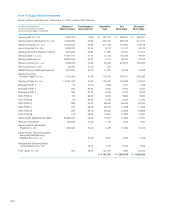
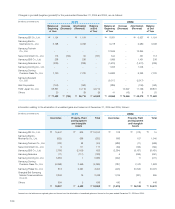
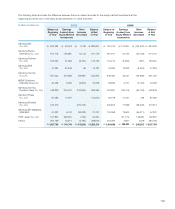
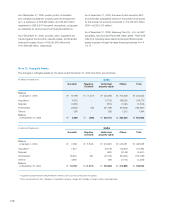
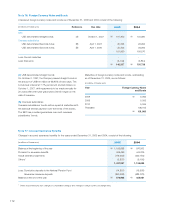
Note 10: Equity-Method Investments
Equity-method investments as of December 31, 2005 consist of the following:
(in millions of Korean won,
except for the number of shares
owned and percentage of ownership)
Number of
Shares Owned
Percentage of
Ownership (%)
Acquisition
Cost
Net
Book Value
Recorded
Book Value
Samsung SDI Co., Ltd. 9,282,753 19.68 \423,722 \ 899,597 \890,801
Samsung Electro-Mechanics Co., Ltd. 17,693,084 22.80 359,237 382,109 371,176
Samsung Techwin Co., Ltd. 19,604,254 25.46 211,726 181,260 179,133
Seoul Commtech Co., Ltd. 3,933,320 35.76 9,172 41,417 40,129
Samsung Economic Research Institute 3,576,000 29.80 17,880 18,220 17,610
Samsung SDS Co., Ltd. 11,977,770 21.27 12,753 102,200 79,187
Samsung Networks Inc. 23,955,550 23.07 5,214 35,642 34,146
Samsung Corning Co., Ltd. 3,665,708 45.29 94,263 253,913 253,342
Samsung Lions Co., Ltd. 55,000 27.50 275 - -
MEMC Electronic Materials Korea, Inc. 3,440,000 20.00 17,200 37,649 37,648
Samsung Corning
Precision Glass Co., Ltd. 1,021,654 41.85 116,140 643,611 629,366
Samsung Thales Co., Ltd. 13,500 ,000 50.00 135,000 104,858 104,520
Bokwang FUND Ⅰ75 50.00 7,500 7,477 7,469
Bokwang FUND Ⅴ500 83.33 5,000 5,672 5,672
Bokwang FUND Ⅹ900 81.82 9,000 8,022 8,042
SVIC FUND Ⅱ69 99.00 6,930 8,992 8,992
SVIC FUND Ⅲ64 99.00 6,435 5,532 5,532
SVIC FUND Ⅳ985 65.67 98,500 95,294 95,294
SVIC FUND Ⅴ297 99.00 29,700 11,948 11,948
SVIC FUND Ⅵ265 99.00 26,532 25,899 25,899
SVIC FUND Ⅶ149 99.00 14,850 14,883 14,883
Samsung SDI (Malaysia) SDN BHD 38,595,040 25.00 18,527 27,986 27,791
Skyworld Corporation 530,000 25.00 1,719 1,224 1,224
Samsung Electro-Mechanics
Thailand Co., Ltd. 1,060,625 25.00 3,478 10,632 10,572
Syrian-Korean Telecommunication
Equipment Manufacturing
Establishment Co., Ltd. - 49.00 2,061 3,769 3,448
Shanghai Bell Samsung Mobile
Communications Co., Ltd - 49.00 7,742 8,074 7,186
TSST Japan Co., Ltd 294 49.00 150,451 7,593 52,304
\1,791,007 \2,943,473 \2,923,314
\ \ \
Ⅰ
Ⅴ
Ⅹ
Ⅰ
Ⅱ
Ⅲ
Ⅳ
Ⅴ
\ \ \