Samsung 2005 Annual Report Download - page 132
Download and view the complete annual report
Please find page 132 of the 2005 Samsung annual report below. You can navigate through the pages in the report by either clicking on the pages listed below, or by using the keyword search tool below to find specific information within the annual report.-
 1
1 -
2
-
3
-
4
-
5
-
6
-
7
-
8
-
9
-
10
-
11
-
12
-
13
-
14
-
15
-
16
-
17
-
18
-
19
-
20
-
21
-
22
-
23
-
24
-
25
-
26
-
27
-
28
-
29
-
30
-
31
-
32
-
33
-
34
-
35
-
36
-
37
-
38
-
39
-
40
-
41
-
42
-
43
-
44
-
45
-
46
-
47
-
48
-
49
-
50
-
51
-
52
-
53
-
54
-
55
-
56
-
57
-
58
-
59
-
60
-
61
-
62
-
63
-
64
-
65
-
66
-
67
-
68
-
69
-
70
-
71
-
72
-
73
-
74
-
75
-
76
-
77
-
78
-
79
-
80
-
81
-
82
-
83
-
84
-
85
-
86
-
87
-
88
-
89
-
90
-
91
-
92
-
93
-
94
-
95
-
96
-
97
-
98
-
99
-
100
-
101
-
102
-
103
-
104
-
105
-
106
-
107
-
108
-
109
-
110
-
111
-
112
-
113
-
114
-
115
-
116
-
117
-
118
-
119
-
120
-
121
-
 122
122 -
 123
123 -
 124
124 -
 125
125 -
 126
126 -
 127
127 -
 128
128 -
 129
129 -
 130
130 -
 131
131 -
 132
132 -
 133
133 -
 134
134 -
 135
135 -
 136
136 -
 137
137 -
 138
138 -
 139
139 -
 140
140 -
 141
141 -
 142
142 -
143
-
144
-
145
-
146
-
147
-
148
 |
 |

130
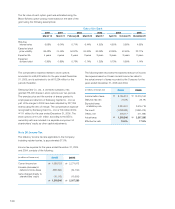
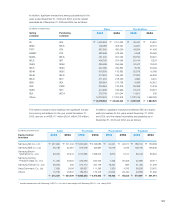
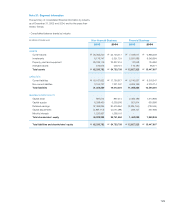
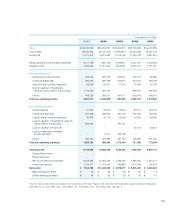
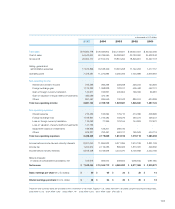
- Consolidated statements of income (loss) by industry
In the above consolidated financial statements of the non-
financial business, the financial service subsidiary has been
accounted for using the equity method.
(in millions of Korean won) Non-financial Business Financial Business
2005 2004 2005 2004
Sales \78,233,772 \78,903,893 \2,401,072 \3,091,908
Cost of sales 54,589,941 52,019,531 667,047 950,528
Selling, general and
administrative expenses 14,692,843 13,414,958 3,110,745 3,850,043
Operating profit (loss) 8,950,988 13,469,404 (1,376,720) (1,708,663)
Non-operating income 2,978,082 2,974,311 41,507 44,605
Non-operating expenses 2,893,328 2,984,605 184,906 186,955
Income (loss) before income tax 9,035,742 13,459,110 (1,520,119) (1,851,013)
Income tax expense (benefit) 1,437,114 2,630,886 (218,868) (423,600)
Income (loss) before minority
interests in earnings of
consolidated subsidiaries, net 7,598,628 10,828,224 (1,301,251) (1,427,413)
Minority interests in earnings of
consolidated subsidiaries, net (41,464) 38,689 - -
Consolidated net income (loss) \7,640,092 \10,789,535 \(1,301,251) \(1,427,413)