Samsung 2005 Annual Report Download - page 105
Download and view the complete annual report
Please find page 105 of the 2005 Samsung annual report below. You can navigate through the pages in the report by either clicking on the pages listed below, or by using the keyword search tool below to find specific information within the annual report.-
 1
1 -
2
-
3
-
4
-
5
-
6
-
7
-
8
-
9
-
10
-
11
-
12
-
13
-
14
-
15
-
16
-
17
-
18
-
19
-
20
-
21
-
22
-
23
-
24
-
25
-
26
-
27
-
28
-
29
-
30
-
31
-
32
-
33
-
34
-
35
-
36
-
37
-
38
-
39
-
40
-
41
-
42
-
43
-
44
-
45
-
46
-
47
-
48
-
49
-
50
-
51
-
52
-
53
-
54
-
55
-
56
-
57
-
58
-
59
-
60
-
61
-
62
-
63
-
64
-
65
-
66
-
67
-
68
-
69
-
70
-
71
-
72
-
73
-
74
-
75
-
76
-
77
-
78
-
79
-
80
-
81
-
82
-
83
-
84
-
85
-
86
-
87
-
88
-
89
-
90
-
91
-
92
-
93
-
94
-
 95
95 -
 96
96 -
 97
97 -
 98
98 -
 99
99 -
 100
100 -
 101
101 -
 102
102 -
 103
103 -
 104
104 -
 105
105 -
 106
106 -
 107
107 -
 108
108 -
 109
109 -
 110
110 -
 111
111 -
 112
112 -
 113
113 -
 114
114 -
 115
115 -
116
-
117
-
118
-
119
-
120
-
121
-
122
-
123
-
124
-
125
-
126
-
127
-
128
-
129
-
130
-
131
-
132
-
133
-
134
-
135
-
136
-
137
-
138
-
139
-
140
-
141
-
142
-
143
-
144
-
145
-
146
-
147
-
148
 |
 |

103
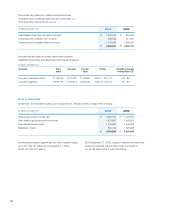
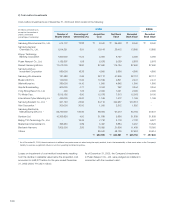
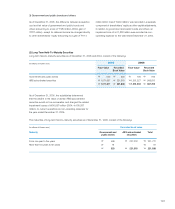
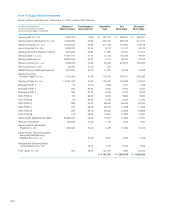
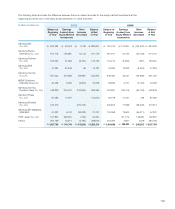
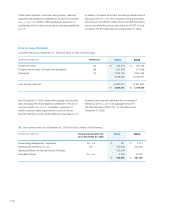
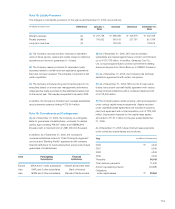
Equity-method investments as of December 31, 2004 consisted of the following:
\ \ \
Ⅰ
Ⅴ
Ⅹ
Ⅱ
Ⅲ
Ⅳ
Ⅴ
Ⅵ
Ⅶ
\ \ \
(in millions of Korean won,
except for the number of shares
owned and percentage of ownership)
Number of
Shares Owned
Percentage of
Ownership (%)
Acquisition
Cost
Net
Book Value
Recorded
Book Value
Samsung SDI Co., Ltd. 9,282,753 19.68 \ 423,722 \ 848,076 \ 824,283
Samsung Electro-Mechanics Co., Ltd. 17,693,084 22.80 359,237 374,844 374,715
Samsung Techwin Co., Ltd. 19,604,254 25.46 211,726 165,411 163,325
Seoul Commtech Co., Ltd. 3,933,320 35.76 8,392 35,361 34,771
Samsung Economic Research Institute 3,576,000 29.80 17,880 18,220 18,200
Samsung SDS Co., Ltd. 11,977,770 21.27 12,753 70,754 47,284
Samsung Networks lnc. 23,955,550 23.07 5,214 28,970 27,364
Samsung Corning Co., Ltd. 3,665,708 45.29 94,263 357,278 351,022
Samsung Lions Co., Ltd. 55,000 27.50 275 - -
MEMC Electronic Materials Korea, Inc. 3,440,000 20.00 17,200 40,468 40,458
Samsung Corning
Precision Glass Co., Ltd. 1,021,654 41.85 116,140 451,076 448,849
Samsung Thales Co., Ltd. 13,500,000 50.00 135,000 91,226 87,483
Samsung Everland 641,123 25.64 64,112 249,690 270,313
Allat Corporation 300,000 30.00 1,500 1,939 1,785
Bokwang FUND Ⅰ750 50.00 7,500 7,625 7,614
Bokwang FUND Ⅴ500 83.33 5,000 5,182 5,182
Bokwang FUND Ⅹ900 81.82 9,000 6,662 6,662
SVIC FUND Ⅰ179 99.44 17,900 4,030 4,249
SVIC FUND Ⅱ297 99.00 29,700 29,411 29,411
SVIC FUND Ⅲ198 99.00 19,800 23,557 23,557
SVIC FUND Ⅳ985 65.67 98,500 81,325 81,325
SVIC FUND Ⅴ297 99.00 29,700 12,109 12,109
Samsung SDI (Malaysia) SDN BHD 38,595,040 25.00 19,408 58,244 57,387
Skyworld Corporation 530,000 25.00 1,801 1,225 1,225
Samsung Electro-Mechanics
Thailand Co., Ltd. 106,062,500 25.00 3,643 13,679 13,654
Syrian-Korean Telecommunication
Equipment Manufacturing
Establishment Co., Ltd. - 49.00 2,061 3,852 3,852
Shanghai Bell Samsung Mobile
Communications Co., Ltd - 49.00 7,742 9,433 13,799
TSST Japan Co., Ltd 294 49.00 150,451 49,061 107,891
\1,869,620 \3,038,708 \3,057,769