Samsung 2005 Annual Report Download - page 136
Download and view the complete annual report
Please find page 136 of the 2005 Samsung annual report below. You can navigate through the pages in the report by either clicking on the pages listed below, or by using the keyword search tool below to find specific information within the annual report.-
 1
1 -
2
-
3
-
4
-
5
-
6
-
7
-
8
-
9
-
10
-
11
-
12
-
13
-
14
-
15
-
16
-
17
-
18
-
19
-
20
-
21
-
22
-
23
-
24
-
25
-
26
-
27
-
28
-
29
-
30
-
31
-
32
-
33
-
34
-
35
-
36
-
37
-
38
-
39
-
40
-
41
-
42
-
43
-
44
-
45
-
46
-
47
-
48
-
49
-
50
-
51
-
52
-
53
-
54
-
55
-
56
-
57
-
58
-
59
-
60
-
61
-
62
-
63
-
64
-
65
-
66
-
67
-
68
-
69
-
70
-
71
-
72
-
73
-
74
-
75
-
76
-
77
-
78
-
79
-
80
-
81
-
82
-
83
-
84
-
85
-
86
-
87
-
88
-
89
-
90
-
91
-
92
-
93
-
94
-
95
-
96
-
97
-
98
-
99
-
100
-
101
-
102
-
103
-
104
-
105
-
106
-
107
-
108
-
109
-
110
-
111
-
112
-
113
-
114
-
115
-
116
-
117
-
118
-
119
-
120
-
121
-
122
-
123
-
124
-
125
-
 126
126 -
 127
127 -
 128
128 -
 129
129 -
 130
130 -
 131
131 -
 132
132 -
 133
133 -
 134
134 -
 135
135 -
 136
136 -
 137
137 -
 138
138 -
 139
139 -
 140
140 -
 141
141 -
 142
142 -
 143
143 -
 144
144 -
 145
145 -
 146
146 -
147
-
148
 |
 |

134
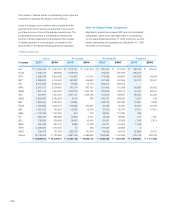
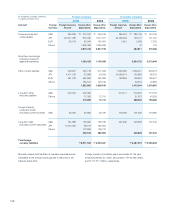
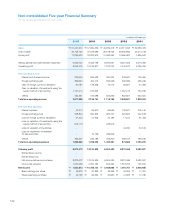
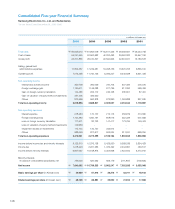
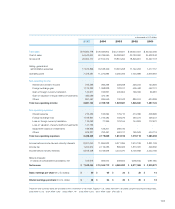
Non-consolidated Five-year Financial Summary
For the Years Ended December 31, 2001-2005
in millions of Korean won
2005 2004 2003 2002 2001
Sales \ 57,457,670 \57,632,359 \ 43,582,016 \ 40,511,563 \ 32,380,375
Cost of sales 40,158,150 37,279,686 29,518,753 26,945,866 24,514,733
Gross profit 17,299,520 20,352,673 14,063,263 13,565,697 7,865,642
Selling, general and administrative expenses 9,239,745 8,335,796 6,870,561 6,321,025 5,570,308
Operating profit 8,059,775 12,016,877 7,192,702 7,244,672 2,295,334
Non-operating income
Interest and dividend income 229,654 295,428 250,205 248,581 126,455
Foreign exchange gain 399,624 402,774 295,269 292,696 239,249
Gain on foreign currency translation 90,187 138,528 13,415 56,957 47,386
Gain on valuation of investments using the
equity method of accounting 1,131,014 576,923 - 1,067,772 784,790
Others 454,361 723,088 556,266 832,651 622,624
Total non-operating income 2,671,359 2,136,741 1,115,155 2,498,657 1,820,504
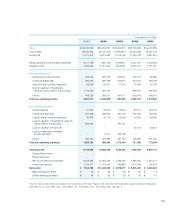
Non-operating expenses
Interest expense 42,214 65,970 95,656 100,501 205,145
Foreign exchange loss 348,804 364,867 355,767 222,905 242,918
Loss on foreign currency translation 31,244 41,903 34,182 17,547 91,493
Loss on valuation of investments using the
equity method of accounting 972,173 - 228,916 - -
Loss on valuation of inventories - - - 42,206 54,129
Loss on impairment of available-
for-sale securities - 10,166 339,646 - -
Others 466,227 546,186 349,200 489,704 439,546
Total non-operating expenses 1,860,662 1,029,092 1,403,367 872,863 1,033,231
Ordinary profit 8,870,472 13,124,526 6,904,490 8,870,466 3,082,607
Extraordinary income - - - - -
Extraordinary loss - - - - -
Net income before income taxes 8,870,472 13,124,526 6,904,490 8,870,466 3,082,607
Income tax expense 1,230,259 2,337,784 945,492 1,818,705 135,672
Net income \7,640,213 \10,786,742 \5,958,998 \7,051,761 \2,946,935
Basic earnings per share \49,970 \67,899 \36,356 \42,005 \17,461
Diluted earnings per share \49,128 \66,864 \35,930 \41,603 \17,230