Samsung 2005 Annual Report Download - page 138
Download and view the complete annual report
Please find page 138 of the 2005 Samsung annual report below. You can navigate through the pages in the report by either clicking on the pages listed below, or by using the keyword search tool below to find specific information within the annual report.-
 1
1 -
2
-
3
-
4
-
5
-
6
-
7
-
8
-
9
-
10
-
11
-
12
-
13
-
14
-
15
-
16
-
17
-
18
-
19
-
20
-
21
-
22
-
23
-
24
-
25
-
26
-
27
-
28
-
29
-
30
-
31
-
32
-
33
-
34
-
35
-
36
-
37
-
38
-
39
-
40
-
41
-
42
-
43
-
44
-
45
-
46
-
47
-
48
-
49
-
50
-
51
-
52
-
53
-
54
-
55
-
56
-
57
-
58
-
59
-
60
-
61
-
62
-
63
-
64
-
65
-
66
-
67
-
68
-
69
-
70
-
71
-
72
-
73
-
74
-
75
-
76
-
77
-
78
-
79
-
80
-
81
-
82
-
83
-
84
-
85
-
86
-
87
-
88
-
89
-
90
-
91
-
92
-
93
-
94
-
95
-
96
-
97
-
98
-
99
-
100
-
101
-
102
-
103
-
104
-
105
-
106
-
107
-
108
-
109
-
110
-
111
-
112
-
113
-
114
-
115
-
116
-
117
-
118
-
119
-
120
-
121
-
122
-
123
-
124
-
125
-
126
-
127
-
 128
128 -
 129
129 -
 130
130 -
 131
131 -
 132
132 -
 133
133 -
 134
134 -
 135
135 -
 136
136 -
 137
137 -
 138
138 -
 139
139 -
 140
140 -
 141
141 -
 142
142 -
 143
143 -
 144
144 -
 145
145 -
 146
146 -
 147
147 -
 148
148
 |
 |

136
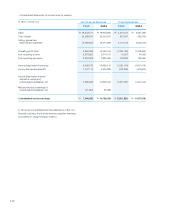
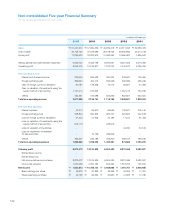
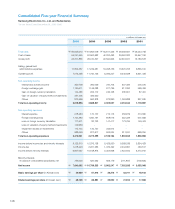
Consolidated Five-year Financial Summary
Samsung Electronics Co., Ltd. and Subsidiaries
For the Years Ended December 31, 2001-2005
in millions of Korean won
2005 2004 2003 2002 2001
Total sales \80,629,510 \81,963,009 \64,817,456 \59,568,661 \46,443,768
Cost of sales 55,251,655 52,952,682 42,252,493 36,952,320 32,657,190
Gross profit 25,377,855 29,010,327 22,564,963 22,616,341 13,786,578
Selling, general and
administrative expenses 17,802,357 17,249,581 16,268,736 13,370,703 9,835,150
Operating profit 7,575,498 11,760,746 6,296,227 9,245,638 3,951,428
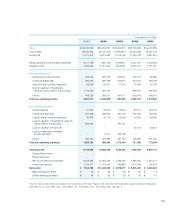
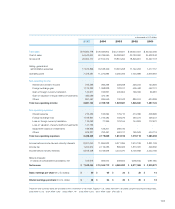
Non-operating income
Interest and dividend income 320,709 382,049 310,703 307,493 205,075
Foreign exchange gain 1,190,611 1,146,088 871,796 611,362 599,486
Gain on foreign currency translation 144,465 202,172 246,168 235,601 87,491
Gain on valuation of equity method investments 491,405 495,620 - - -
Others 872,666 662,878 873,860 1,063,888 827,935
Total non-operating income 3,019,856 2,888,807 2,302,527 2,218,344 1,719,987
Non-operating expenses
Interest expense 218,233 170,107 215,113 256,919 410,660
Foreign exchange loss 1,124,380 1,060,191 908,016 552,329 607,668
Loss on foreign currency translation 117,571 80,723 147,417 173,764 149,403
Loss on valuation of equity method investments 149,656 - - - -
Impairment losses on investments 172,145 134,757 345,614 - -
Others 688,056 827,617 553,034 911,931 669,255
Total non-operating expenses 2,470,041 2,273,395 2,169,194 1,894,943 1,836,986
Income before income tax and minority interests 8,125,313 12,376,158 6,429,560 9,569,039 3,834,429
Income tax 1,218,246 2,207,285 1,076,492 2,244,397 463,517
Income before minority interests 6,907,067 10,168,873 5,353,068 7,324,642 3,370,912
Minority interests
in losses of consolidated subsidiaries, net 733,025 620,662 609,179 (271,807) (315,846)
Net income \7,640,092 \10,789,535 \5,962,247 \7,052,835 \3,055,066
Basic earnings per share (in Korean won) \49,969 \67,916 \36,376 \42,011 \18,102
Diluted earnings per share (in Korean won) \49,128 \66,881 \35,950 \41,610 \17,858