Samsung 2005 Annual Report Download - page 134
Download and view the complete annual report
Please find page 134 of the 2005 Samsung annual report below. You can navigate through the pages in the report by either clicking on the pages listed below, or by using the keyword search tool below to find specific information within the annual report.
132
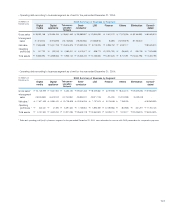
(in millions of
Korean won) 2005 Summary of Business by Geographic Area
Korea
(Domestic)
Korea
(Export)
Asia America Europe Africa Elimination Consoli-
dated
Gross sales \16,486,869 \50,719,397 \43,268,723 \24,872,774 \25,898,349 \543,918 \(81,160,520) \80,629,510
Intersegment
sales (4,171,148) (45,773,056) (18,082,515) (7,781,560) (5,352,172) (69) 81,160,520 -
Net sales \12,315,721 \4,946,341 \25,186,208 \17,091,214 \20,546,177 \543,849 - \80,629,510
Operating
profit (loss) \ 6,629,701 \512,711 \20,721 \118,893 \12,703 \280,709 \7,575,498
Total assets \ 67,799,075 \ 8,824,865 \5,819,311 \5,895,379 \125,363 \(14,002,195) \74,461,798
- Operating data of entities classified according to geographic area as of and for the year ended December 31, 2005:
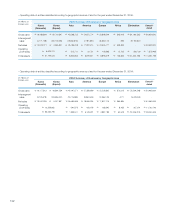
(in millions of
Korean won) 2004 Summary of Business by Geographic Area
Korea
(Domestic)
Korea
(Export)
Asia America Europe Africa Elimination Consoli-
dated
Gross sales \16,177,813 \48,864,259 \43,197,071 \27,358,939 \22,203,862 \370,313 \(76,209,248) \81,963,009
Intersegment
sales (3,126,578) (43,636,422) (16,716,383) (8,362,645) (4,366,743) (477) 76,209,248 -
Net sales \13,051,235 \5,227,837 \26,480,688 \18,996,294 \17,837,119 \369,836 - \81,963,009
Operating
profit (loss) \ 10,258,862 \591,573 \426,195 \168,392 \8,433 \307,291 \11,760,746
Total assets \ 63,235,796 \ 7,899,511 \6,143,291 \4,887,783 \64,618 \(13,226,374) \69,004,625
- Operating data of entities classified according to geographic area as of and for the year ended December 31, 2004:


