Samsung 2005 Annual Report Download - page 78
Download and view the complete annual report
Please find page 78 of the 2005 Samsung annual report below. You can navigate through the pages in the report by either clicking on the pages listed below, or by using the keyword search tool below to find specific information within the annual report.-
 1
1 -
2
-
3
-
4
-
5
-
6
-
7
-
8
-
9
-
10
-
11
-
12
-
13
-
14
-
15
-
16
-
17
-
18
-
19
-
20
-
21
-
22
-
23
-
24
-
25
-
26
-
27
-
28
-
29
-
30
-
31
-
32
-
33
-
34
-
35
-
36
-
37
-
38
-
39
-
40
-
41
-
42
-
43
-
44
-
45
-
46
-
47
-
48
-
49
-
50
-
51
-
52
-
53
-
54
-
55
-
56
-
57
-
58
-
59
-
60
-
61
-
62
-
63
-
64
-
65
-
66
-
67
-
 68
68 -
 69
69 -
 70
70 -
 71
71 -
 72
72 -
 73
73 -
 74
74 -
 75
75 -
 76
76 -
 77
77 -
 78
78 -
 79
79 -
 80
80 -
 81
81 -
 82
82 -
 83
83 -
 84
84 -
 85
85 -
 86
86 -
 87
87 -
 88
88 -
89
-
90
-
91
-
92
-
93
-
94
-
95
-
96
-
97
-
98
-
99
-
100
-
101
-
102
-
103
-
104
-
105
-
106
-
107
-
108
-
109
-
110
-
111
-
112
-
113
-
114
-
115
-
116
-
117
-
118
-
119
-
120
-
121
-
122
-
123
-
124
-
125
-
126
-
127
-
128
-
129
-
130
-
131
-
132
-
133
-
134
-
135
-
136
-
137
-
138
-
139
-
140
-
141
-
142
-
143
-
144
-
145
-
146
-
147
-
148
 |
 |

76
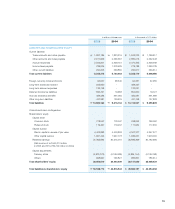
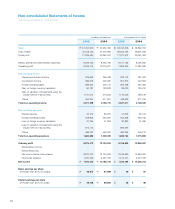
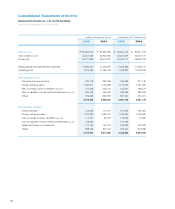
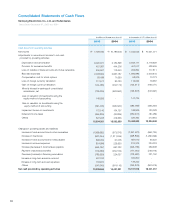
in millions of Korean won (note 3) in thousands of U.S. dollars (note 3)
2005 2004 2005 2004
Sales (note 28) \80,629,510 \81,963,009 $ 79,594,778 $ 80,911,164
Cost of sales (note 28) 55,251,655 52,952,682 54,542,601 52,273,131
Gross profit 25,377,855 29,010,327 25,052,177 28,638,033
Selling, general and administrative expenses 17,802,357 17,249,581 17,573,896 17,028,214
Operating profit 7,575,498 11,760,746 7,478,281 11,609,819
Non-operating income
Interest and dividend income 320,709 382,049 316,593 377,146
Foreign exchange gains 1,190,611 1,146,088 1,175,332 1,131,380
Gain on foreign currency translation (note 30) 144,465 202,172 142,611 199,577
Gain on valuation of equity method investments (note 10) 491,405 495,620 485,099 489,260
Others 872,666 662,878 861,467 654,371
3,019,856 2,888,807 2,981,102 2,851,734
Non-operating expenses
Interest expense 218,233 170,107 215,432 167,924
Foreign exchange losses 1,124,380 1,060,191 1,109,951 1,046,585
Loss on foreign currency translation (note 30) 117,571 80,723 116,062 79,687
Loss on valuation of equity method investments (note 10) 149,656 - 147,735 -
Impairment losses on investments 172,145 134,757 169,936 133,028
Others 688,056 827,617 679,227 816,996
2,470,041 2,273,395 2,438,343 2,244,220
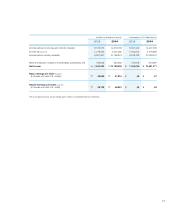
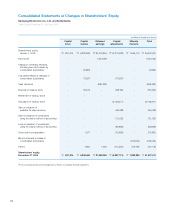
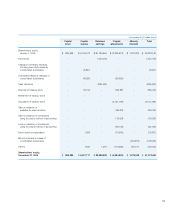
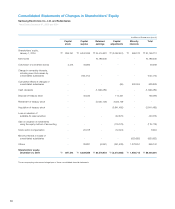
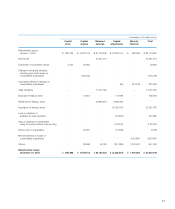
Consolidated Statements of Income
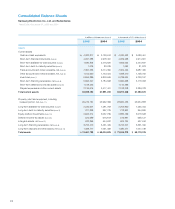
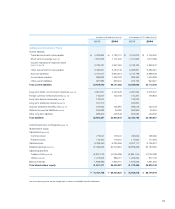
Samsung Electronics Co., Ltd. and Subsidiaries
Years Ended December 31, 2005 and 2004