Samsung 2005 Annual Report Download - page 84
Download and view the complete annual report
Please find page 84 of the 2005 Samsung annual report below. You can navigate through the pages in the report by either clicking on the pages listed below, or by using the keyword search tool below to find specific information within the annual report.-
 1
1 -
2
-
3
-
4
-
5
-
6
-
7
-
8
-
9
-
10
-
11
-
12
-
13
-
14
-
15
-
16
-
17
-
18
-
19
-
20
-
21
-
22
-
23
-
24
-
25
-
26
-
27
-
28
-
29
-
30
-
31
-
32
-
33
-
34
-
35
-
36
-
37
-
38
-
39
-
40
-
41
-
42
-
43
-
44
-
45
-
46
-
47
-
48
-
49
-
50
-
51
-
52
-
53
-
54
-
55
-
56
-
57
-
58
-
59
-
60
-
61
-
62
-
63
-
64
-
65
-
66
-
67
-
68
-
69
-
70
-
71
-
72
-
73
-
 74
74 -
 75
75 -
 76
76 -
 77
77 -
 78
78 -
 79
79 -
 80
80 -
 81
81 -
 82
82 -
 83
83 -
 84
84 -
 85
85 -
 86
86 -
 87
87 -
 88
88 -
 89
89 -
 90
90 -
 91
91 -
 92
92 -
 93
93 -
 94
94 -
95
-
96
-
97
-
98
-
99
-
100
-
101
-
102
-
103
-
104
-
105
-
106
-
107
-
108
-
109
-
110
-
111
-
112
-
113
-
114
-
115
-
116
-
117
-
118
-
119
-
120
-
121
-
122
-
123
-
124
-
125
-
126
-
127
-
128
-
129
-
130
-
131
-
132
-
133
-
134
-
135
-
136
-
137
-
138
-
139
-
140
-
141
-
142
-
143
-
144
-
145
-
146
-
147
-
148
 |
 |

82
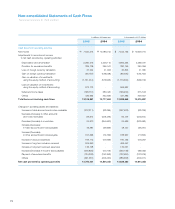
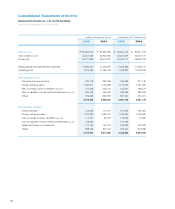
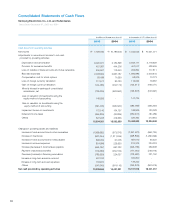
Consolidated Statements of Cash Flows
Samsung Electronics Co., Ltd. and Subsidiaries
Years Ended December 31, 2005 and 2004
in millions of Korean won (note 3) in thousands of U.S. dollars (note 3)
2005 2004 2005 2004
Cash flows from operating activities
Net income \7,640,092 \10,789,535 $ 7,542,045 $ 10,651,071
Adjustments to reconcile net income to net cash
provided by operating activities
Depreciation and amortization 6,020,371 5,184,898 5,943,111 5,118,359
Provision for severance benefits 457,387 444,206 451,517 438,505
Loss on transfer of trade accounts and notes receivable 205,501 119,343 202,864 117,811
Bad debt expenses 2,008,662 2,637,187 1,982,885 2,603,344
Compensation cost for stock options 59,439 71,693 58,676 70,773
Loss on foreign currency translation 117,571 80,723 116,062 79,687
Gain on foreign currency translation (144,465) (202,172) (142,611) (199,577)
Minority interest in earnings of consolidated
subsidiaries, net (733,025) (620,662) (723,618) (612,697)
Loss on valuation of investments using the
equity method of accounting 149,656 - 147,735 -
Gain on valuation on investments using the
equity method of accounting (491,405) (495,620) (485,099) (489,260)
Impairment losses on investments 172,145 134,757 169,936 133,028
Deferred income taxes (354,826) (30,885) (350,272) (30,489)
Others 527,228 419,335 520,462 413,954
15,634,331 18,532,338 15,433,693 18,294,509
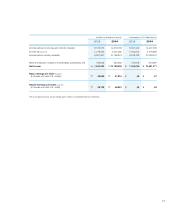
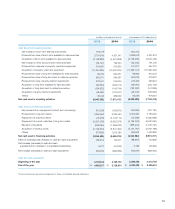
Changes in operating assets and liabilities
Increase in trade accounts and notes receivables (1,966,662) (673,376) (1,941,423) (664,734)
Increase in inventories (637,044) (1,311,935) (628,869) (1,295,099)
Increase in trade accounts and notes payable 696,002 61,005 687,070 60,222
Increase in accrued expenses 824,899 226,930 814,313 224,018
Increase (decrease) in income taxes payable (655,197) 597,232 (646,789) 589,568
Payment of severance benefits (179,363) (250,184) (177,061) (246,973)
Decrease (increase) in financing receivables (783,639) 224,037 (773,582) 221,162
Increase in long-term advance received 507,310 - 500,800 -
Increase in long-term accrued expenses 134,974 - 133,242 -
Others (247,045) (974,116) (243,876) (961,616)
Net cash provided by operating activities 13,328,566 16,431,931 13,157,518 16,221,057