Samsung 2005 Annual Report Download - page 85
Download and view the complete annual report
Please find page 85 of the 2005 Samsung annual report below. You can navigate through the pages in the report by either clicking on the pages listed below, or by using the keyword search tool below to find specific information within the annual report.-
 1
1 -
2
-
3
-
4
-
5
-
6
-
7
-
8
-
9
-
10
-
11
-
12
-
13
-
14
-
15
-
16
-
17
-
18
-
19
-
20
-
21
-
22
-
23
-
24
-
25
-
26
-
27
-
28
-
29
-
30
-
31
-
32
-
33
-
34
-
35
-
36
-
37
-
38
-
39
-
40
-
41
-
42
-
43
-
44
-
45
-
46
-
47
-
48
-
49
-
50
-
51
-
52
-
53
-
54
-
55
-
56
-
57
-
58
-
59
-
60
-
61
-
62
-
63
-
64
-
65
-
66
-
67
-
68
-
69
-
70
-
71
-
72
-
73
-
74
-
 75
75 -
 76
76 -
 77
77 -
 78
78 -
 79
79 -
 80
80 -
 81
81 -
 82
82 -
 83
83 -
 84
84 -
 85
85 -
 86
86 -
 87
87 -
 88
88 -
 89
89 -
 90
90 -
 91
91 -
 92
92 -
 93
93 -
 94
94 -
 95
95 -
96
-
97
-
98
-
99
-
100
-
101
-
102
-
103
-
104
-
105
-
106
-
107
-
108
-
109
-
110
-
111
-
112
-
113
-
114
-
115
-
116
-
117
-
118
-
119
-
120
-
121
-
122
-
123
-
124
-
125
-
126
-
127
-
128
-
129
-
130
-
131
-
132
-
133
-
134
-
135
-
136
-
137
-
138
-
139
-
140
-
141
-
142
-
143
-
144
-
145
-
146
-
147
-
148
 |
 |
83
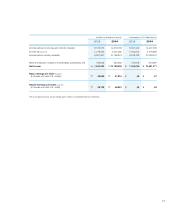
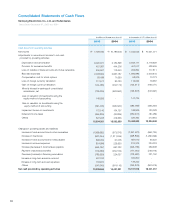
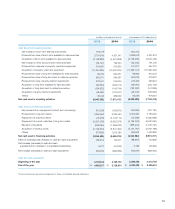
in millions of Korean won (note 3) in thousands of U.S. dollars (note 3)
2005 2004 2005 2004
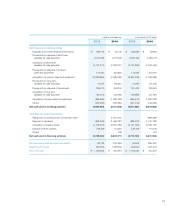
Cash flows from investing activities
Net increase in short-term financial instruments 912,019 - 900,315 -
Proceeds from sale of short-term available-for-sale securities 3,734,545 4,307,147 3,686,619 4,251,873
Acquisition of short-term available-for-sale securities (3,148,892) (4,672,698) (3,108,482) (4,612,732)
Net increase in other accounts and notes receivable (53,147) 193,524 (52,465) 191,040
Proceeds from disposal of property, plant and equipment 244,961 574,625 241,817 567,251
Acquisition of property, plant and equipment (11,540,225) (10,497,204) (11,392,127) (10,362,492)
Proceeds from sale of long-term available-for-sale securities 69,750 922,257 68,855 910,422
Proceeds from sale of long-term held-to-maturity securities 662,071 584,437 653,575 576,937
Proceeds from sale of equity-method investments 279,041 240,004 275,460 236,924
Acquisition of long-term available-for-sale securities (60,564) (206,774) (59,787) (204,120)
Acquisition of long-term held-to-maturity securities (134,822) (143,744) (133,092) (141,899)
Acquisition of equity-method investments (46,362) (161,047) (45,767) (158,980)
Others 36,043 989,056 35,580 976,361
Net cash used in investing activities (9,045,582) (7,870,417) (8,929,499) (7,769,415)
Cash flows from financing activities
Net proceeds from (repayment of) short-term borrowings 815,328 (193,672) 804,865 (191,187)
Proceeds from long-term debts 3,350,653 3,224,434 3,307,654 3,183,054
Repayment of long-term debts (76,378) (2,123,112) (75,398) (2,095,866)
Repayment of current maturities of long-term debts (5,231,209) (6,622,079) (5,164,076) (6,537,097)
Payment of dividends (849,364) (1,596,282) (838,464) (1,575,797)
Acquisition of treasury stock (2,149,370) (3,841,484) (2,121,787) (3,792,186)
Others 873,856 1,513,280 862,642 1,493,862
Net cash used in financing activities (3,266,484) (9,638,915) (3,224,564) (9,515,217)
Effect of exchange rate changes on cash and cash equivalents (69,574) 125,577 (68,681) 123,965
Net increase (decrease) in cash and cash
equivalents from changes in consolidated subsidiaries 6,277 (44,262) 6,196 (43,694)
Net increase (decrease) in cash and cash equivalents 953,203 (996,086) 940,970 (983,304)
Cash and cash equivalents
Beginning of the year 3,129,614 4,125,700 3,089,452 4,072,755
End of the year \4,082,817 \3,129,614 $4,030,422 $3,089,451
The accompanying notes are an integral part of these consolidated financial statements.