Samsung 2005 Annual Report Download - page 4
Download and view the complete annual report
Please find page 4 of the 2005 Samsung annual report below. You can navigate through the pages in the report by either clicking on the pages listed below, or by using the keyword search tool below to find specific information within the annual report.-
 1
1 -
 2
2 -
 3
3 -
 4
4 -
 5
5 -
 6
6 -
 7
7 -
 8
8 -
 9
9 -
 10
10 -
 11
11 -
 12
12 -
 13
13 -
 14
14 -
 15
15 -
16
-
17
-
18
-
19
-
20
-
21
-
22
-
23
-
24
-
25
-
26
-
27
-
28
-
29
-
30
-
31
-
32
-
33
-
34
-
35
-
36
-
37
-
38
-
39
-
40
-
41
-
42
-
43
-
44
-
45
-
46
-
47
-
48
-
49
-
50
-
51
-
52
-
53
-
54
-
55
-
56
-
57
-
58
-
59
-
60
-
61
-
62
-
63
-
64
-
65
-
66
-
67
-
68
-
69
-
70
-
71
-
72
-
73
-
74
-
75
-
76
-
77
-
78
-
79
-
80
-
81
-
82
-
83
-
84
-
85
-
86
-
87
-
88
-
89
-
90
-
91
-
92
-
93
-
94
-
95
-
96
-
97
-
98
-
99
-
100
-
101
-
102
-
103
-
104
-
105
-
106
-
107
-
108
-
109
-
110
-
111
-
112
-
113
-
114
-
115
-
116
-
117
-
118
-
119
-
120
-
121
-
122
-
123
-
124
-
125
-
126
-
127
-
128
-
129
-
130
-
131
-
132
-
133
-
134
-
135
-
136
-
137
-
138
-
139
-
140
-
141
-
142
-
143
-
144
-
145
-
146
-
147
-
148
 |
 |
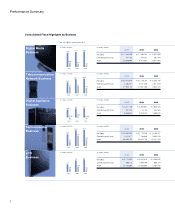
Performance Summary
2
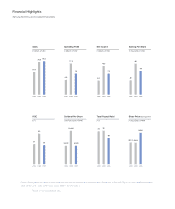
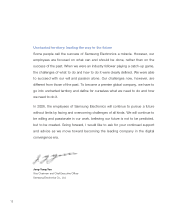
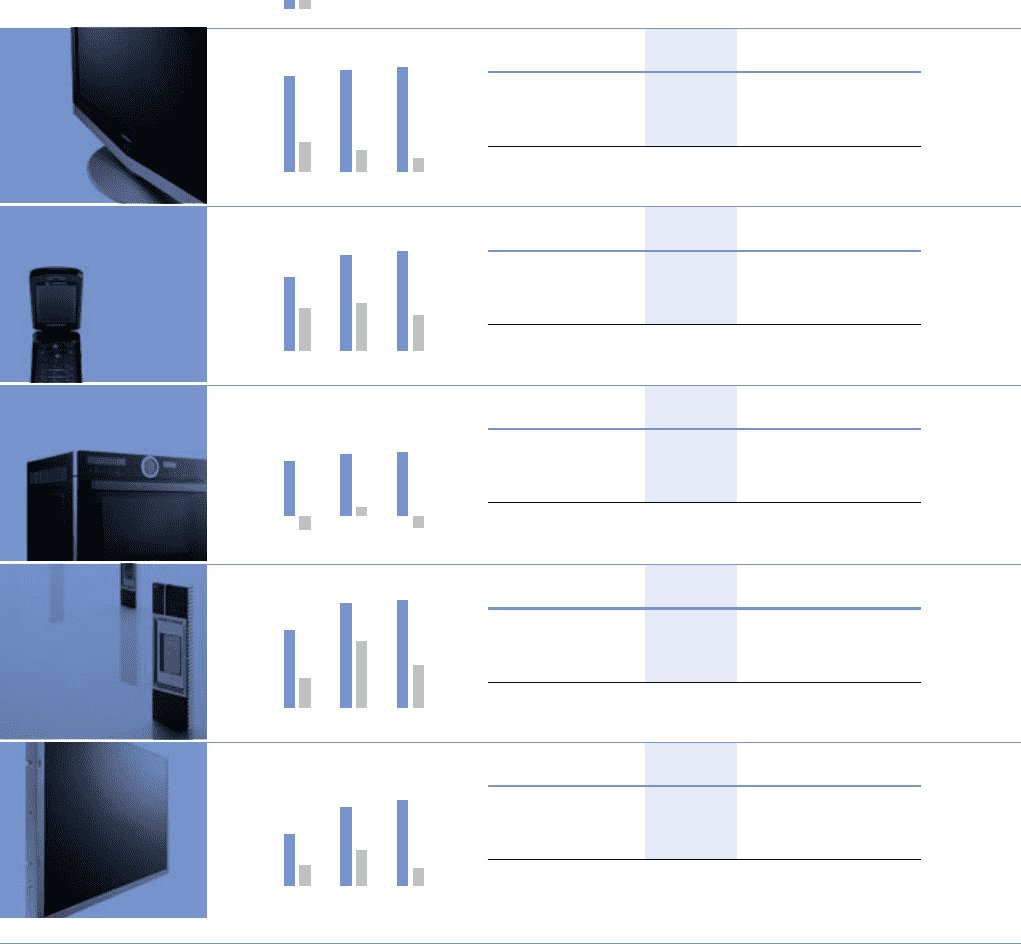
Consolidated Fiscal Highlights by Business
2003 2004 2005
2.8 3.1
2.5
15.3
20.7 20.9
(in trillions of KRW)
2003 2004 2005
4.9 5.4 5.6
(0.05)0.02 (0.03)
(in trillions of KRW)
(in millions of KRW)
2005 2004 2003
Net sales \ 20,332,235 \ 21,715,218 \ 14,190,227
Operating profit (loss)5,410,677 7,766,848 3,692,239
Asset 26,326,732 25,623,728 22,247,780
(in millions of KRW)
2005 2004 2003
Net sales \ 8,715,225 \ 9,091,670 \ 4,366,642
Operating profit (loss) 598,773 1,895,189 889,765
Asset 14,135,584 10,662,823 5,581,410
(in millions of KRW)
2005 2004 2003
Net sales \ 5,617,708 \ 5,390,822 \ 4,936,535
Operating profit (loss)(29,102) 21,740 (49,160)
Asset 3,658,525 3,403,424 3,688,652
(in millions of KRW)
2005 2004 2003
Net sales \ 20,914,815 \ 20,729,730 \ 15,303,152
Operating profit (loss)2,480,001 3,097,458 2,817,809
Asset 11,965,742 10,927,036 9,825,081
(in millions of KRW)
2005 2004 2003
Net sales \ 17,656,558 \ 17,686,204 \ 15,921,963
Operating profit (loss)247,700 442,057 567,424
Asset 10,848,994 9,101,900 8,877,694
2003 2004 2005
14.2
20.2 20.3
3.7
7.8
5.4
(in trillions of KRW)
2003 2004 2005
4.4
7.8 8.7
0.9
1.9
0.6
(in trillions of KRW)
2003 2004 2005
15.9
0.6
17.6 17.7
0.4 0.2
(in trillions of KRW)
Operating profit (loss)
Net sales
Telecommunication
Network Business
Digital Media
Business
Semiconductor
Business
Digital Appliance
Business
LCD
Business