Pizza Hut 2013 Annual Report Download - page 80
Download and view the complete annual report
Please find page 80 of the 2013 Pizza Hut annual report below. You can navigate through the pages in the report by either clicking on the pages listed below, or by using the keyword search tool below to find specific information within the annual report.-
 1
1 -
2
-
3
-
4
-
5
-
6
-
7
-
8
-
9
-
10
-
11
-
12
-
13
-
14
-
15
-
16
-
17
-
18
-
19
-
20
-
21
-
22
-
23
-
24
-
25
-
26
-
27
-
28
-
29
-
30
-
31
-
32
-
33
-
34
-
35
-
36
-
37
-
38
-
39
-
40
-
41
-
42
-
43
-
44
-
45
-
46
-
47
-
48
-
49
-
50
-
51
-
52
-
53
-
54
-
55
-
56
-
57
-
58
-
59
-
60
-
61
-
62
-
63
-
64
-
65
-
66
-
67
-
68
-
69
-
 70
70 -
 71
71 -
 72
72 -
 73
73 -
 74
74 -
 75
75 -
 76
76 -
 77
77 -
 78
78 -
 79
79 -
 80
80 -
 81
81 -
 82
82 -
 83
83 -
 84
84 -
 85
85 -
 86
86 -
 87
87 -
 88
88 -
 89
89 -
 90
90 -
91
-
92
-
93
-
94
-
95
-
96
-
97
-
98
-
99
-
100
-
101
-
102
-
103
-
104
-
105
-
106
-
107
-
108
-
109
-
110
-
111
-
112
-
113
-
114
-
115
-
116
-
117
-
118
-
119
-
120
-
121
-
122
-
123
-
124
-
125
-
126
-
127
-
128
-
129
-
130
-
131
-
132
-
133
-
134
-
135
-
136
-
137
-
138
-
139
-
140
-
141
-
142
-
143
-
144
-
145
-
146
-
147
-
148
-
149
-
150
-
151
-
152
-
153
-
154
-
155
-
156
-
157
-
158
-
159
-
160
-
161
-
162
-
163
-
164
-
165
-
166
-
167
-
168
-
169
-
170
-
171
-
172
-
173
-
174
-
175
-
176
-
177
-
178
 |
 |

YUM! BRANDS, INC.-2014Proxy Statement58
Proxy Statement
EXECUTIVE COMPENSATION
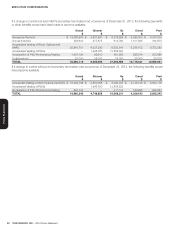
If a change in control and each NEO’s involuntary termination had occurred as of December 31, 2013, the following payments
or other benefits would have been made or become available.
Novak
$
Grismer
$
Su
$
Creed
$
Pant
$
Severance Payment $ 12,068,640 $ 2,821,520 $ 6,279,625 $ 5,595,000 $ 4,740,000
Annual Incentive 939,600 277,875 614,790 1,511,625 784,875
Accelerated Vesting of Stock Options and
SARs 20,915,721 4,337,290 6,633,614 5,288,102 6,753,080
Accelerated Vesting of RSUs — 1,946,760 13,858,633 — —
Acceleration of PSU Performance/Vesting 1,407,154 56,910 481,902 295,614 303,686
Outplacement 25,000 25,000 25,000 25,000 25,000
TOTAL 35,356,115 9,465,355 27,893,564 12,715,341 12,606,641
If a change in control without an involuntary termination had occurred as of December 31, 2013, the following benefits would
have become available.
Novak
$
Grismer
$
Su
$
Creed
$
Pant
$
Accelerated Vesting of Stock Options and SARs $ 16,338,799 $ 2,800,068 $ 5,096,405 $ 4,135,198 $ 5,600,176
Accelerated Vesting of RSUs — 1,946,760 13,858,633 — —
Acceleration of PSU Performance/Vesting 624,743 — 311,173 193,995 202,067
TOTAL 16,963,542 4,746,828 19,266,211 4,329,193 5,802,243