Pizza Hut 2013 Annual Report Download - page 66
Download and view the complete annual report
Please find page 66 of the 2013 Pizza Hut annual report below. You can navigate through the pages in the report by either clicking on the pages listed below, or by using the keyword search tool below to find specific information within the annual report.-
 1
1 -
2
-
3
-
4
-
5
-
6
-
7
-
8
-
9
-
10
-
11
-
12
-
13
-
14
-
15
-
16
-
17
-
18
-
19
-
20
-
21
-
22
-
23
-
24
-
25
-
26
-
27
-
28
-
29
-
30
-
31
-
32
-
33
-
34
-
35
-
36
-
37
-
38
-
39
-
40
-
41
-
42
-
43
-
44
-
45
-
46
-
47
-
48
-
49
-
50
-
51
-
52
-
53
-
54
-
55
-
 56
56 -
 57
57 -
 58
58 -
 59
59 -
 60
60 -
 61
61 -
 62
62 -
 63
63 -
 64
64 -
 65
65 -
 66
66 -
 67
67 -
 68
68 -
 69
69 -
 70
70 -
 71
71 -
 72
72 -
 73
73 -
 74
74 -
 75
75 -
 76
76 -
77
-
78
-
79
-
80
-
81
-
82
-
83
-
84
-
85
-
86
-
87
-
88
-
89
-
90
-
91
-
92
-
93
-
94
-
95
-
96
-
97
-
98
-
99
-
100
-
101
-
102
-
103
-
104
-
105
-
106
-
107
-
108
-
109
-
110
-
111
-
112
-
113
-
114
-
115
-
116
-
117
-
118
-
119
-
120
-
121
-
122
-
123
-
124
-
125
-
126
-
127
-
128
-
129
-
130
-
131
-
132
-
133
-
134
-
135
-
136
-
137
-
138
-
139
-
140
-
141
-
142
-
143
-
144
-
145
-
146
-
147
-
148
-
149
-
150
-
151
-
152
-
153
-
154
-
155
-
156
-
157
-
158
-
159
-
160
-
161
-
162
-
163
-
164
-
165
-
166
-
167
-
168
-
169
-
170
-
171
-
172
-
173
-
174
-
175
-
176
-
177
-
178
 |
 |

YUM! BRANDS, INC.-2014Proxy Statement44
Proxy Statement
EXECUTIVE COMPENSATION
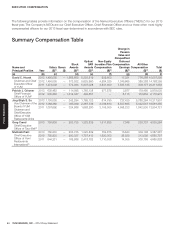
The following tables provide information on the compensation of the Named Executive Officers (“NEOs”) for our 2013
fiscal year. The Company’s NEOs are our Chief Executive Officer, Chief Financial Officer and our three other most highly
compensated officers for our 2013 fiscal year determined in accordance with SEC rules.
Summary Compensation Table
Name and
PrincipalPosition Year
Salary
($)(1)
Bonus
($)
Stock
Awards
($)(2)
Option/
SAR
Awards
($)(3)
Non-Equity
Incentive Plan
Compensation
($)(4)
Change in
Pension
Value and
Nonqualified
Deferred
Compensation
Earnings
($)(5)
All Other
Compensation
($)(6)
Total
($)
(a) (b) (c) (d) (e) (f) (g) (h) (i)
DavidC. Novak
Chairman and Chief
Executive Officer
ofYUM
2013 1,450,000 — 1,568,655 5,255,519 939,600 17,351 776,268 10,007,393
2012 1,450,000 — 773,022 5,625,960 4,584,320 1,345,665 389,388 14,168,355
2011 1,474,038 — 773,024 5,807,028 4,541,400 7,507,185 309,177 20,411,852
Patrick J. Grismer
Chief Financial
Officer of YUM(7)
2013 638,462 —114,098 1,765,138 277,875 3,977 179,480 2,979,030
2012 500,308 — 1,014,347 493,551 — 6,115 104,652 2,118,973
Jing-Shyh S. Su
Vice Chairman of the
Board of YUM
Chairman and
Chief Executive
Officer ofYUM
Restaurants China
2013 1,100,000 — 342,294 1,765,123 614,790 727,430 5,768,264 10,317,901
2012 1,088,462 —385,029 2,467,739 2,039,813 5,537,865 5,042,547 16,561,455
2011 1,007,692 — 324,986 1,668,280 3,105,000 4,556,233 1,842,530 12,504,721
Greg Creed
Chief Executive
Officerof Taco Bell(8)
2013 750,000 — 203,735 1,323,839 1,511,625 7,348 238,737 4,035,284
Muktesh Pant
Chief Executive
Officer of Yum!
Restaurants
International(9)
2013 750,000 — 203,735 1,323,839 784,875 15,640 309,198 3,387,287
2012 750,000 — 250,027 1,727,413 1,620,000 25,225 313,092 4,685,757
2011 644,231 — 169,986 2,418,782 1,110,038 14,005 308,786 4,665,828