Pizza Hut 2013 Annual Report Download - page 137
Download and view the complete annual report
Please find page 137 of the 2013 Pizza Hut annual report below. You can navigate through the pages in the report by either clicking on the pages listed below, or by using the keyword search tool below to find specific information within the annual report.-
 1
1 -
2
-
3
-
4
-
5
-
6
-
7
-
8
-
9
-
10
-
11
-
12
-
13
-
14
-
15
-
16
-
17
-
18
-
19
-
20
-
21
-
22
-
23
-
24
-
25
-
26
-
27
-
28
-
29
-
30
-
31
-
32
-
33
-
34
-
35
-
36
-
37
-
38
-
39
-
40
-
41
-
42
-
43
-
44
-
45
-
46
-
47
-
48
-
49
-
50
-
51
-
52
-
53
-
54
-
55
-
56
-
57
-
58
-
59
-
60
-
61
-
62
-
63
-
64
-
65
-
66
-
67
-
68
-
69
-
70
-
71
-
72
-
73
-
74
-
75
-
76
-
77
-
78
-
79
-
80
-
81
-
82
-
83
-
84
-
85
-
86
-
87
-
88
-
89
-
90
-
91
-
92
-
93
-
94
-
95
-
96
-
97
-
98
-
99
-
100
-
101
-
102
-
103
-
104
-
105
-
106
-
107
-
108
-
109
-
110
-
111
-
112
-
113
-
114
-
115
-
116
-
117
-
118
-
119
-
120
-
121
-
122
-
123
-
124
-
125
-
126
-
 127
127 -
 128
128 -
 129
129 -
 130
130 -
 131
131 -
 132
132 -
 133
133 -
 134
134 -
 135
135 -
 136
136 -
 137
137 -
 138
138 -
 139
139 -
 140
140 -
 141
141 -
 142
142 -
 143
143 -
 144
144 -
 145
145 -
 146
146 -
 147
147 -
148
-
149
-
150
-
151
-
152
-
153
-
154
-
155
-
156
-
157
-
158
-
159
-
160
-
161
-
162
-
163
-
164
-
165
-
166
-
167
-
168
-
169
-
170
-
171
-
172
-
173
-
174
-
175
-
176
-
177
-
178
 |
 |

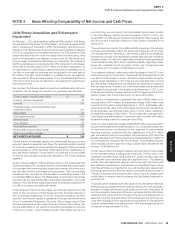
YUM! BRANDS, INC.-2013 Form10-K 41
Form 10-K
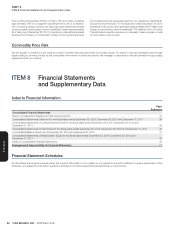
PART II
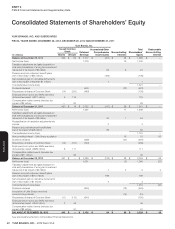
ITEM 8Financial Statements andSupplementaryData
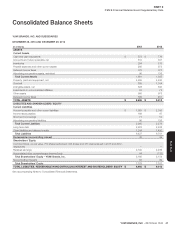
Consolidated Balance Sheets
YUM! BRANDS, INC. AND SUBSIDIARIES
DECEMBER 28, 2013 AND DECEMBER 29, 2012
(in millions)
2013 2012
ASSETS
Current Assets
Cash and cash equivalents $ 573 $ 776
Accounts and notes receivable, net 319 301
Inventories 294 313
Prepaid expenses and other current assets 286 272
Deferred income taxes 123 127
Advertising cooperative assets, restricted 96 136
Total Current Assets 1,691 1,925
Property, plant and equipment, net 4,459 4,250
Goodwill 889 1,034
Intangible assets, net 638 690
Investments in unconsolidated affiliates 53 72
Other assets 566 575
Deferred income taxes 399 467
TOTAL ASSETS $ 8,695 $ 9,013
LIABILITIES AND SHAREHOLDERS’ EQUITY
Current Liabilities
Accounts payable and other current liabilities $ 1,929 $ 2,036
Income taxes payable 169 97
Short-term borrowings 71 10
Advertising cooperative liabilities 96 136
Total Current Liabilities 2,265 2,279
Long-term debt 2,918 2,932
Other liabilities and deferred credits 1,244 1,490
Total Liabilities 6,427 6,701
Redeemable noncontrolling interest 39 59
Shareholders’ Equity
Common Stock, no par value, 750 shares authorized; 443 shares and 451 shares issued in 2013 and 2012,
respectively — —
Retained earnings 2,102 2,286
Accumulated other comprehensive income (loss) 64 (132)
Total Shareholders’ Equity – YUM! Brands, Inc. 2,166 2,154
Noncontrolling interests 63 99
Total Shareholders’ Equity 2,229 2,253
TOTAL LIABILITIES, REDEEMABLE NONCONTROLLING INTEREST AND SHAREHOLDERS’ EQUITY $ 8,695 $ 9,013
See accompanying Notes to Consolidated Financial Statements.