Pizza Hut 2013 Annual Report Download - page 161
Download and view the complete annual report
Please find page 161 of the 2013 Pizza Hut annual report below. You can navigate through the pages in the report by either clicking on the pages listed below, or by using the keyword search tool below to find specific information within the annual report.-
 1
1 -
2
-
3
-
4
-
5
-
6
-
7
-
8
-
9
-
10
-
11
-
12
-
13
-
14
-
15
-
16
-
17
-
18
-
19
-
20
-
21
-
22
-
23
-
24
-
25
-
26
-
27
-
28
-
29
-
30
-
31
-
32
-
33
-
34
-
35
-
36
-
37
-
38
-
39
-
40
-
41
-
42
-
43
-
44
-
45
-
46
-
47
-
48
-
49
-
50
-
51
-
52
-
53
-
54
-
55
-
56
-
57
-
58
-
59
-
60
-
61
-
62
-
63
-
64
-
65
-
66
-
67
-
68
-
69
-
70
-
71
-
72
-
73
-
74
-
75
-
76
-
77
-
78
-
79
-
80
-
81
-
82
-
83
-
84
-
85
-
86
-
87
-
88
-
89
-
90
-
91
-
92
-
93
-
94
-
95
-
96
-
97
-
98
-
99
-
100
-
101
-
102
-
103
-
104
-
105
-
106
-
107
-
108
-
109
-
110
-
111
-
112
-
113
-
114
-
115
-
116
-
117
-
118
-
119
-
120
-
121
-
122
-
123
-
124
-
125
-
126
-
127
-
128
-
129
-
130
-
131
-
132
-
133
-
134
-
135
-
136
-
137
-
138
-
139
-
140
-
141
-
142
-
143
-
144
-
145
-
146
-
147
-
148
-
149
-
150
-
 151
151 -
 152
152 -
 153
153 -
 154
154 -
 155
155 -
 156
156 -
 157
157 -
 158
158 -
 159
159 -
 160
160 -
 161
161 -
 162
162 -
 163
163 -
 164
164 -
 165
165 -
 166
166 -
 167
167 -
 168
168 -
 169
169 -
 170
170 -
 171
171 -
172
-
173
-
174
-
175
-
176
-
177
-
178
 |
 |

YUM! BRANDS, INC.-2013 Form10-K 65
Form 10-K
PART II
ITEM 8Financial Statements andSupplementaryData
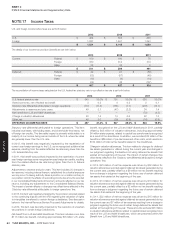
Other.This item primarily includes the impact of permanent differences
related to current year earnings as well as U.S. tax credits and deductions.
In 2013, this item was negatively impacted by the $222 million non-cash
impairment of Little Sheep goodwill, which resulted in no related tax benefit.
In 2012, this item was positively impacted by a one-time pre-tax gain of
$74 million, with no related income tax expense, recognized on our
acquisition of additional interest in, and consolidation of Little Sheep.
The details of 2013 and 2012 deferred tax assets (liabilities) are set forth below:
2013 2012
Operating losses and tax credit carryforwards $ 310 $ 337
Employee benefits 182 251
Share-based compensation 118 108
Self-insured casualty claims 48 50
Lease-related liabilities 120 115
Various liabilities 88 82
Property, plant and equipment 42 39
Deferred income and other 58 57
Gross deferred tax assets 966 1,039
Deferred tax asset valuation allowances (203) (200)
Net deferred tax assets $ 763 $ 839
Intangible assets, including goodwill $ (233) $ (256)
Property, plant and equipment (93) (95)
Other (55) (48)
Gross deferred tax liabilities $ (381) $ (399)
NET DEFERRED TAX ASSETS (LIABILITIES) $ 382 $ 440
Reported in Consolidated Balance Sheets as:
Deferred income taxes – current $ 123 $ 127
Deferred income taxes – long-term 399 467
Accounts payable and other current liabilities (2) (5)
Other liabilities and deferred credits (138) (149)
$ 382 $ 440
We have investments in foreign subsidiaries where the carrying values for
financial reporting exceed the tax basis. We have not provided deferred
tax on the portion of the excess that we believe is essentially permanent
in duration. This amount may become taxable upon an actual or deemed
repatriation of assets from the subsidiaries or a sale or liquidation of
the subsidiaries. We estimate that our total temporary difference upon
which we have not provided deferred tax is approximately $2.6 billion at
December 28, 2013. A determination of the deferred tax liability on this
amount is not practicable.
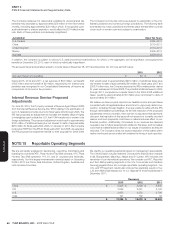
At December 28, 2013, the Company has foreign operating and capital loss
carryforwards of $0.6 billion and U.S. state operating loss, capital loss and
tax credit carryforwards of $1.2 billion and U.S. federal capital loss and tax
credit carryforwards of $0.2 billion. These losses are being carried forward in
jurisdictions where we are permitted to use tax losses from prior periods to
reduce future taxable income and will expire as follows:
Year of Expiration
Total2014 2015-2018 2019-2033 Indefinitely
Foreign $ 38 $ 132 $ 91 $ 325 $ 586
U.S. state 16 105 1,040 — 1,161
U.S. federal — 90 64 — 154
$ 54 $ 327 $ 1,195 $ 325 $ 1,901
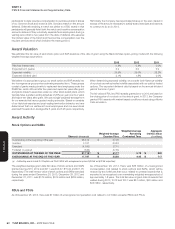
We recognize the benefit of positions taken or expected to be taken in
tax returns in the financial statements when it is more likely than not that
the position would be sustained upon examination by tax authorities. A
recognized tax position is measured at the largest amount of benefit that
is greater than fifty percent likely of being realized upon settlement.
The Company had $243 million and $309 million of unrecognized tax benefits
at December 28, 2013 and December 29, 2012, respectively, $170 million
and $184 million of which, if recognized, would impact the effective income
tax rate. A reconciliation of the beginning and ending amount of unrecognized
tax benefits follows:
2013 2012
Beginning of Year $ 309 $ 348
Additions on tax positions - current year 19 50
Additions for tax positions - prior years 55 23
Reductions for tax positions - prior years (102) (90)
Reductions for settlements (23) (6)
Reductions due to statute expiration (16) (16)
Foreign currency translation adjustment 1 —
END OF YEAR $ 243 $ 309