Pizza Hut 2013 Annual Report Download - page 167
Download and view the complete annual report
Please find page 167 of the 2013 Pizza Hut annual report below. You can navigate through the pages in the report by either clicking on the pages listed below, or by using the keyword search tool below to find specific information within the annual report.-
 1
1 -
2
-
3
-
4
-
5
-
6
-
7
-
8
-
9
-
10
-
11
-
12
-
13
-
14
-
15
-
16
-
17
-
18
-
19
-
20
-
21
-
22
-
23
-
24
-
25
-
26
-
27
-
28
-
29
-
30
-
31
-
32
-
33
-
34
-
35
-
36
-
37
-
38
-
39
-
40
-
41
-
42
-
43
-
44
-
45
-
46
-
47
-
48
-
49
-
50
-
51
-
52
-
53
-
54
-
55
-
56
-
57
-
58
-
59
-
60
-
61
-
62
-
63
-
64
-
65
-
66
-
67
-
68
-
69
-
70
-
71
-
72
-
73
-
74
-
75
-
76
-
77
-
78
-
79
-
80
-
81
-
82
-
83
-
84
-
85
-
86
-
87
-
88
-
89
-
90
-
91
-
92
-
93
-
94
-
95
-
96
-
97
-
98
-
99
-
100
-
101
-
102
-
103
-
104
-
105
-
106
-
107
-
108
-
109
-
110
-
111
-
112
-
113
-
114
-
115
-
116
-
117
-
118
-
119
-
120
-
121
-
122
-
123
-
124
-
125
-
126
-
127
-
128
-
129
-
130
-
131
-
132
-
133
-
134
-
135
-
136
-
137
-
138
-
139
-
140
-
141
-
142
-
143
-
144
-
145
-
146
-
147
-
148
-
149
-
150
-
151
-
152
-
153
-
154
-
155
-
156
-
 157
157 -
 158
158 -
 159
159 -
 160
160 -
 161
161 -
 162
162 -
 163
163 -
 164
164 -
 165
165 -
 166
166 -
 167
167 -
 168
168 -
 169
169 -
 170
170 -
 171
171 -
 172
172 -
 173
173 -
 174
174 -
 175
175 -
 176
176 -
 177
177 -
178
 |
 |

YUM! BRANDS, INC.-2013 Form10-K 71
Form 10-K
PART II
ITEM 8Financial Statements andSupplementaryData
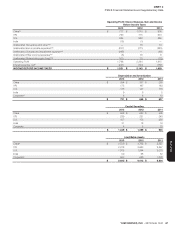
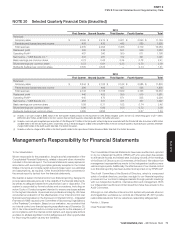
NOTE20 Selected Quarterly Financial Data (Unaudited)
2013
First Quarter Second Quarter Third Quarter Fourth Quarter Total
Revenues:
Company sales $ 2,099 $ 2,474 $ 3,021 $ 3,590 $ 11,184
Franchise and license fees and income 436 430 445 589 1,900
Total revenues 2,535 2,904 3,466 4,179 13,084
Restaurant profit 333 310 531 509 1,683
Operating Profit(a) 487 390 350 571 1,798
Net Income – YUM! Brands, Inc.(c) 337 281 152 321 1,091
Basic earnings per common share 0.74 0.62 0.34 0.72 2.41
Diluted earnings per common share 0.72 0.61 0.33 0.70 2.36
Dividends declared per common share 0.335 0.335 — 0.74 1.41
2012
First Quarter Second Quarter Third Quarter Fourth Quarter Total
Revenues:
Company sales $ 2,344 $ 2,762 $ 3,142 $ 3,585 $ 11,833
Franchise and license fees and income 399 406 427 568 1,800
Total revenues 2,743 3,168 3,569 4,153 13,633
Restaurant profit 440 423 599 519 1,981
Operating Profit(b) 645 473 671 505 2,294
Net Income – YUM! Brands, Inc. 458 331 471 337 1,597
Basic earnings per common share 0.99 0.71 1.02 0.74 3.46
Diluted earnings per common share 0.96 0.69 1.00 0.72 3.38
Dividends declared per common share 0.285 0.285 — 0.67 1.24
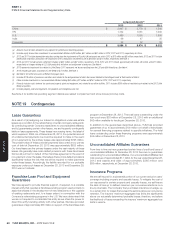
(a) Includes a non-cash charge of $295 million in the third quarter related primarily to the impairment of Little Sheep intangible assets and net U.S. refranchising gains of $17 million,
$28 million, $37 million and $9 million in the first, second, third and fourth quarters, respectively. See Note 4 for further discussion.
(b) Includes a non-cash gain recognized upon acquisition of Little Sheep of $74 million in the first quarter, refranchising losses associated with the Pizza Hut UK dine-in business of $24 million
and $46 million in the first and fourth quarters, respectively, net U.S. refranchising gains of $45 million and $69 million in the first and fourth quarters, respectively and a pension settlement
charge of $84 million in the fourth quarter. See Note 4 for further discussion.
(c) Includes an after-tax charge of $75 million in the fourth quarter related to the repurchase of Senior Unsecured Notes. See Note 4 for further discussion.
Management’s Responsibility for Financial Statements
To Our Shareholders:
We are responsible for the preparation, integrity and fair presentation of the
Consolidated Financial Statements, related notes and other information
included in this annual report. The financial statements were prepared in
accordance with accounting principles generally accepted in the United
States of America and include certain amounts based upon our estimates
and assumptions, as required. Other financial information presented in
the annual report is derived from the financial statements.
We maintain a system of internal control over financial reporting, designed to
provide reasonable assurance as to the reliability of the financial statements,
as well as to safeguard assets from unauthorized use or disposition. The
system is supported by formal policies and procedures, including an
active Code of Conduct program intended to ensure employees adhere
to the highest standards of personal and professional integrity. We have
conducted an evaluation of the effectiveness of our internal control over
financial reporting based on the framework in Internal Control – Integrated
Framework (1992) issued by the Committee of Sponsoring Organizations
of the Treadway Commission. Based on our evaluation, we concluded that
our internal control over financial reporting was effective as of December 28,
2013. Our internal audit function monitors and reports on the adequacy of
and compliance with the internal control system, and appropriate actions
are taken to address significant control deficiencies and other opportunities
for improving the system as they are identified.
The Consolidated Financial Statements have been audited and reported
on by our independent auditors, KPMG LLP, who were given free access
to all financial records and related data, including minutes of the meetings
of the Board of Directors and Committees of the Board. We believe that
management representations made to the independent auditors were
valid and appropriate. Additionally, the effectiveness of our internal control
over financial reporting has been audited and reported on by KPMG LLP.
The Audit Committee of the Board of Directors, which is composed
solely of outside directors, provides oversight to our financial reporting
process and our controls to safeguard assets through periodic meetings
with our independent auditors, internal auditors and management. Both
our independent auditors and internal auditors have free access to the
Audit Committee.
Although no cost-effective internal control system will preclude all errors
and irregularities, we believe our controls as of December 28, 2013 provide
reasonable assurance that our assets are reasonably safeguarded.
Patrick J. Grismer
Chief Financial Officer