Pizza Hut 2013 Annual Report Download - page 53
Download and view the complete annual report
Please find page 53 of the 2013 Pizza Hut annual report below. You can navigate through the pages in the report by either clicking on the pages listed below, or by using the keyword search tool below to find specific information within the annual report.-
 1
1 -
2
-
3
-
4
-
5
-
6
-
7
-
8
-
9
-
10
-
11
-
12
-
13
-
14
-
15
-
16
-
17
-
18
-
19
-
20
-
21
-
22
-
23
-
24
-
25
-
26
-
27
-
28
-
29
-
30
-
31
-
32
-
33
-
34
-
35
-
36
-
37
-
38
-
39
-
40
-
41
-
42
-
 43
43 -
 44
44 -
 45
45 -
 46
46 -
 47
47 -
 48
48 -
 49
49 -
 50
50 -
 51
51 -
 52
52 -
 53
53 -
 54
54 -
 55
55 -
 56
56 -
 57
57 -
 58
58 -
 59
59 -
 60
60 -
 61
61 -
 62
62 -
 63
63 -
64
-
65
-
66
-
67
-
68
-
69
-
70
-
71
-
72
-
73
-
74
-
75
-
76
-
77
-
78
-
79
-
80
-
81
-
82
-
83
-
84
-
85
-
86
-
87
-
88
-
89
-
90
-
91
-
92
-
93
-
94
-
95
-
96
-
97
-
98
-
99
-
100
-
101
-
102
-
103
-
104
-
105
-
106
-
107
-
108
-
109
-
110
-
111
-
112
-
113
-
114
-
115
-
116
-
117
-
118
-
119
-
120
-
121
-
122
-
123
-
124
-
125
-
126
-
127
-
128
-
129
-
130
-
131
-
132
-
133
-
134
-
135
-
136
-
137
-
138
-
139
-
140
-
141
-
142
-
143
-
144
-
145
-
146
-
147
-
148
-
149
-
150
-
151
-
152
-
153
-
154
-
155
-
156
-
157
-
158
-
159
-
160
-
161
-
162
-
163
-
164
-
165
-
166
-
167
-
168
-
169
-
170
-
171
-
172
-
173
-
174
-
175
-
176
-
177
-
178
 |
 |

YUM! BRANDS, INC.-2014Proxy Statement 31
Proxy Statement
EXECUTIVE COMPENSATION
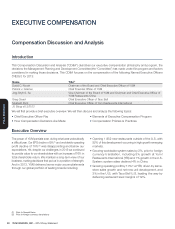
Chief Executive Officer Pay
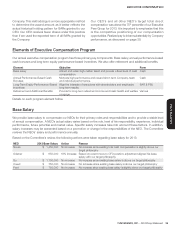
Our compensation program is designed to support our
long-term Company growth model, while holding our
executives accountable to achieve key annual results year
over year. As discussed on page 29, our CEO’s pay is tied
to performance, as 89% of Mr. Novak’s 2013 target pay
is at-risk. As demonstrated below, our Company has
continued to experience growth under the leadership and
strategic vision of Mr. Novak since he was named CEO in
2000. Mr. Novak is compensated in accordance with this
long-term perspective.
485%
Market Capitalization Growth
YUM’S LONG-TERM GROWTH UNDER MR. NOVAK’S LEADERSHIP
2000 2013
$5.7b
market capitalization $33.7b
market capitalization
(1) Restaurant count includes licensed units
Build powerful brands
• KFC is #1 brand in China;
• Pizza Hut China Casual Dining is #1
western casual dining chain with a
6:1 advantage;
• Taco Bell named marketer of the year
in the U.S.
Drive aggressive expansion
• Increased global restaurant counts by
33% to over 40,000(1) in 128 countries,
giving us almost a 2:1 advantage in
emerging markets
Create industry leading returns
• Achieved 13 year 855% total
shareholder return
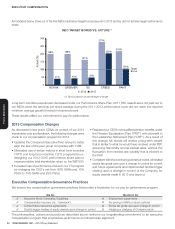
Every January the Committee makes decisions about the CEO’s target compensation based on performance and market
competitiveness. For 2013, the Committee determined that our CEO’s target cash compensation, consisting of base
salary and target bonus, was competitive compared to our Executive Peer Group and did not increase these elements.
In regards to actual cash compensation for 2013, our CEO’s pay decreased by 60% compared to the prior year, largely
due to an 80% decline in annual bonus. His annual bonus reflects below target performance. As demonstrated at page 32,
our CEO’s cash compensation correlates with earnings per share growth, which is our primary business performance
metric.