Pizza Hut 2013 Annual Report Download - page 70
Download and view the complete annual report
Please find page 70 of the 2013 Pizza Hut annual report below. You can navigate through the pages in the report by either clicking on the pages listed below, or by using the keyword search tool below to find specific information within the annual report.-
 1
1 -
2
-
3
-
4
-
5
-
6
-
7
-
8
-
9
-
10
-
11
-
12
-
13
-
14
-
15
-
16
-
17
-
18
-
19
-
20
-
21
-
22
-
23
-
24
-
25
-
26
-
27
-
28
-
29
-
30
-
31
-
32
-
33
-
34
-
35
-
36
-
37
-
38
-
39
-
40
-
41
-
42
-
43
-
44
-
45
-
46
-
47
-
48
-
49
-
50
-
51
-
52
-
53
-
54
-
55
-
56
-
57
-
58
-
59
-
 60
60 -
 61
61 -
 62
62 -
 63
63 -
 64
64 -
 65
65 -
 66
66 -
 67
67 -
 68
68 -
 69
69 -
 70
70 -
 71
71 -
 72
72 -
 73
73 -
 74
74 -
 75
75 -
 76
76 -
 77
77 -
 78
78 -
 79
79 -
 80
80 -
81
-
82
-
83
-
84
-
85
-
86
-
87
-
88
-
89
-
90
-
91
-
92
-
93
-
94
-
95
-
96
-
97
-
98
-
99
-
100
-
101
-
102
-
103
-
104
-
105
-
106
-
107
-
108
-
109
-
110
-
111
-
112
-
113
-
114
-
115
-
116
-
117
-
118
-
119
-
120
-
121
-
122
-
123
-
124
-
125
-
126
-
127
-
128
-
129
-
130
-
131
-
132
-
133
-
134
-
135
-
136
-
137
-
138
-
139
-
140
-
141
-
142
-
143
-
144
-
145
-
146
-
147
-
148
-
149
-
150
-
151
-
152
-
153
-
154
-
155
-
156
-
157
-
158
-
159
-
160
-
161
-
162
-
163
-
164
-
165
-
166
-
167
-
168
-
169
-
170
-
171
-
172
-
173
-
174
-
175
-
176
-
177
-
178
 |
 |

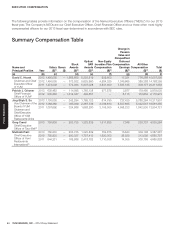
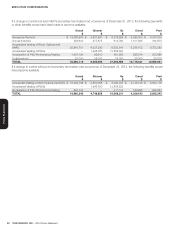
YUM! BRANDS, INC.-2014Proxy Statement48
Proxy Statement
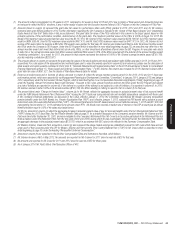
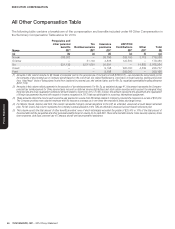
EXECUTIVE COMPENSATION
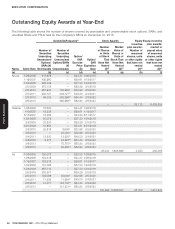
Outstanding Equity Awards at Year-End
The following table shows the number of shares covered by exercisable and unexercisable stock options, SARs, and
unvested RSUs and PSUs held by the Company’s NEOs on December 31, 2013.
Name Grant Date
Option/SAR Awards(1) Stock Awards Equity
incentive
plan awards:
Number of
unearned
shares, units
or other rights
that have not
vested
(#)(4)
Equity incentive
plan awards:
market or
payout value
of unearned
shares, units
or other rights
that have not
vested
($)(3)
Number of
Securities
Underlying
Unexercised
Options/
SARs (#)
Exercisable
Number of
Securities
Underlying
Unexercised
Options/SARs
(#)
Unexercisable
Option/
SAR
Exercise
Price
($)
Option/
SAR
Expiration
Date
Number
of Shares
or Units
of Stock
That
Have Not
Vested
(#)(2)
Market
Value of
Shares or
Units of
Stock That
Have Not
Vested
($)(3)
(a)
(b) (c)
(d) (e) (f) (g) (h) (i)
Novak 1/26/2006 517,978 — $24.47 1/26/2016
1/19/2007 490,960 — $29.61 1/19/2017
1/24/2008 428,339 — $37.30 1/24/2018
2/5/2009 575,102 — $29.29 2/5/2019
2/5/2010 467,943 155,982(i) $32.98 2/5/2020
2/4/2011 248,127 248,127(ii) $49.30 2/4/2021
2/8/2012 94,332 282,996(iii) $64.44 2/8/2022
2/6/2013 — 360,956(iv) $62.93 2/6/2023
— — 85,172 6,439,855
Grismer 1/26/2006 16,630 — $24.47 1/26/2016
1/19/2007 19,938 — $29.61 1/19/2017
5/17/2007 16,262 — $33.20 5/17/2017
1/24/2008 20,079 — $37.30 1/24/2018
2/5/2009 33,830 — $29.29 2/5/2019
5/21/2009 15,853 — $33.21 5/21/2019
2/5/2010 25,818 8,606(i) $32.98 2/5/2020
2/5/2010 — 43,030(v) $32.98 2/5/2020
2/4/2011 12,220 12,220(ii) $49.30 2/4/2021
2/8/2012 8,275 24,827(iii) $64.44 2/8/2022
2/6/2013 — 75,770(iv) $62.93 2/6/2023
2/6/2013 — 45,462(vi) $62.93 2/6/2023
25,244 1,908,699 4,450 336,465
Su 1/28/2005 130,078 — $22.53 1/28/2015
1/26/2006 124,316 — $24.47 1/26/2016
1/19/2007 132,918 — $29.61 1/19/2017
1/24/2008 107,085 — $37.30 1/24/2018
1/24/2008 267,712 — $37.30 1/24/2018
2/5/2009 202,977 — $29.29 2/5/2019
2/5/2010 129,088 43,030(i) $32.98 2/5/2020
2/4/2011 71,283 71,284(ii) $49.30 2/4/2021
2/8/2012 41,377 124,132(iii) $64.44 2/8/2022
2/6/2013 — 121,231(iv) $62.93 2/6/2023
183,290 13,858,557 25,300 1,912,933