Pizza Hut 2013 Annual Report Download - page 124
Download and view the complete annual report
Please find page 124 of the 2013 Pizza Hut annual report below. You can navigate through the pages in the report by either clicking on the pages listed below, or by using the keyword search tool below to find specific information within the annual report.-
 1
1 -
2
-
3
-
4
-
5
-
6
-
7
-
8
-
9
-
10
-
11
-
12
-
13
-
14
-
15
-
16
-
17
-
18
-
19
-
20
-
21
-
22
-
23
-
24
-
25
-
26
-
27
-
28
-
29
-
30
-
31
-
32
-
33
-
34
-
35
-
36
-
37
-
38
-
39
-
40
-
41
-
42
-
43
-
44
-
45
-
46
-
47
-
48
-
49
-
50
-
51
-
52
-
53
-
54
-
55
-
56
-
57
-
58
-
59
-
60
-
61
-
62
-
63
-
64
-
65
-
66
-
67
-
68
-
69
-
70
-
71
-
72
-
73
-
74
-
75
-
76
-
77
-
78
-
79
-
80
-
81
-
82
-
83
-
84
-
85
-
86
-
87
-
88
-
89
-
90
-
91
-
92
-
93
-
94
-
95
-
96
-
97
-
98
-
99
-
100
-
101
-
102
-
103
-
104
-
105
-
106
-
107
-
108
-
109
-
110
-
111
-
112
-
113
-
 114
114 -
 115
115 -
 116
116 -
 117
117 -
 118
118 -
 119
119 -
 120
120 -
 121
121 -
 122
122 -
 123
123 -
 124
124 -
 125
125 -
 126
126 -
 127
127 -
 128
128 -
 129
129 -
 130
130 -
 131
131 -
 132
132 -
 133
133 -
 134
134 -
135
-
136
-
137
-
138
-
139
-
140
-
141
-
142
-
143
-
144
-
145
-
146
-
147
-
148
-
149
-
150
-
151
-
152
-
153
-
154
-
155
-
156
-
157
-
158
-
159
-
160
-
161
-
162
-
163
-
164
-
165
-
166
-
167
-
168
-
169
-
170
-
171
-
172
-
173
-
174
-
175
-
176
-
177
-
178
 |
 |

YUM! BRANDS, INC.-2013 Form10-K28
Form 10-K
PART II
ITEM7Management’s Discussion and Analysis of Financial Condition and Results of Operations
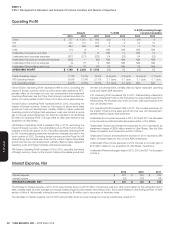
Operating Profit
Amount % B/(W)
% B/(W) excluding foreign
currency translation
2013 2012 2011 2013 2012 2013 2012
China $ 777 $ 1,015 $ 908 (23) 12 (26) 9
YRI 760 715 673 6 6 10 10
U.S. 684 666 589 3 13 3 13
India (15) (1) — NM NM NM NM
Unallocated Occupancy and other — 16 14 NM 14 NM 14
Unallocated and corporate expenses (207) (271) (223) 24 (22) 24 (22)
Unallocated Closures and impairment expense (295) — (80) NM NM NM NM
Unallocated Other income (expense) (6) 76 6 NM NM NM NM
Unallocated Refranchising gain (loss) 100 78 (72) 29 NM 29 NM
OPERATING PROFIT $ 1,798 $ 2,294 $ 1,815 (22) 26 (22) 26
China Operating margin 11.3% 14.7% 16.3% (3.4) ppts. (1.6) ppts. (3.5) ppts. (1.7) ppts.
YRI Operating margin 24.5% 21.8% 21.1% 2.7 ppts. 0.7 ppts. 3.1 ppts. 0.7 ppts.
U.S. Operating margin 23.2% 19.9% 15.5% 3.3 ppts. 4.4 ppts. N/A N/A
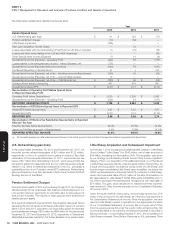
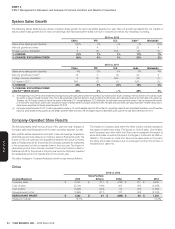
China Division Operating Profit decreased 26% in 2013, excluding the
impact of foreign currency, driven by same-store sales declines at KFC,
partially offset by the impact of new unit development and restaurant
operating efficiencies. See the China Poultry Supply Incident and Avian Flu
section for further details on KFC China’s 2013 same-store sales declines.
China Division Operating Profit increased 9% in 2012, excluding the
impact of foreign currency, driven by the impact of same-store sales
growth and new unit development, partially offset by higher restaurant
operating costs and higher G&A expenses. Leap year added an extra
day in the year ended December 29, 2012 and resulted in an additional
$5 million of Operating Profit. This was offset by deal costs related to the
acquisition of Little Sheep.
YRI Division Operating Profit increased 10% in 2013, excluding the
impact of foreign currency. The refranchising of our Pizza Hut UK dine-in
business in the fourth quarter of 2012 favorably impacted Operating Profit
by 3%, including lapping restaurant impairment charges recorded in the
fourth quarter of 2012. Excluding foreign currency and the Pizza Hut UK
refranchising, the increase was driven by the impact of same-store sales
growth and net new unit development, partially offset by higher restaurant
operating costs and higher franchise and license expenses.
YRI Division Operating Profit increased 10% in 2012, excluding the impact
of foreign currency, driven by the impact of same-store sales growth and
net new unit development, partially offset by higher restaurant operating
costs and higher G&A expenses.
U.S. Operating Profit increased 3% in 2013. Refranchising unfavorably
impacted Operating Profit by 3%. Excluding the unfavorable impact from
refranchising, the increase was driven by lower G&A expenses and net
new unit development.
U.S. Operating Profit increased 13% in 2012. The increase was driven by
the impact of same-store sales growth and net new unit development,
partially offset by higher G&A expenses.
Unallocated and corporate expenses in 2013, 2012 and 2011 are discussed
in the General and Administrative Expenses section of the MD&A.
Unallocated Closure and impairment expenses for 2013 represents an
impairment charge of $295 million related to Little Sheep. See the Little
Sheep Acquisition and Impairment section of Note 4.
Unallocated Closure and impairment expense in 2011 represents $80
million of losses related to the LJS and A&W divestitures.
Unallocated Other income (expense) in 2012 includes a non-cash gain of
$74 million related to our acquisition of Little Sheep. See Note 4.
Unallocated Refranchising gain (loss) in 2013, 2012 and 2011 is discussed
in Note 4.
Interest Expense, Net
2013 2012 2011
Interest expense $ 270 $ 169 $ 184
Interest income (23) (20) (28)
INTEREST EXPENSE, NET $ 247 $ 149 $ 156
The increase in Interest expense, net for 2013 was primarily driven by $118 million of premiums paid and other costs related to the extinguishment of
debt, partially offset by lower average borrowings outstanding and lower interest rates versus 2012. See Losses Related to the Extinguishment of Debt
section of Note 4. Additionally, Interest income increased by $9 million due to recoveries of franchise notes.
The decrease in Interest expense, net for 2012 was primarily driven by lower average borrowings outstanding versus 2011.