Pizza Hut 2013 Annual Report Download - page 116
Download and view the complete annual report
Please find page 116 of the 2013 Pizza Hut annual report below. You can navigate through the pages in the report by either clicking on the pages listed below, or by using the keyword search tool below to find specific information within the annual report.-
 1
1 -
2
-
3
-
4
-
5
-
6
-
7
-
8
-
9
-
10
-
11
-
12
-
13
-
14
-
15
-
16
-
17
-
18
-
19
-
20
-
21
-
22
-
23
-
24
-
25
-
26
-
27
-
28
-
29
-
30
-
31
-
32
-
33
-
34
-
35
-
36
-
37
-
38
-
39
-
40
-
41
-
42
-
43
-
44
-
45
-
46
-
47
-
48
-
49
-
50
-
51
-
52
-
53
-
54
-
55
-
56
-
57
-
58
-
59
-
60
-
61
-
62
-
63
-
64
-
65
-
66
-
67
-
68
-
69
-
70
-
71
-
72
-
73
-
74
-
75
-
76
-
77
-
78
-
79
-
80
-
81
-
82
-
83
-
84
-
85
-
86
-
87
-
88
-
89
-
90
-
91
-
92
-
93
-
94
-
95
-
96
-
97
-
98
-
99
-
100
-
101
-
102
-
103
-
104
-
105
-
 106
106 -
 107
107 -
 108
108 -
 109
109 -
 110
110 -
 111
111 -
 112
112 -
 113
113 -
 114
114 -
 115
115 -
 116
116 -
 117
117 -
 118
118 -
 119
119 -
 120
120 -
 121
121 -
 122
122 -
 123
123 -
 124
124 -
 125
125 -
 126
126 -
127
-
128
-
129
-
130
-
131
-
132
-
133
-
134
-
135
-
136
-
137
-
138
-
139
-
140
-
141
-
142
-
143
-
144
-
145
-
146
-
147
-
148
-
149
-
150
-
151
-
152
-
153
-
154
-
155
-
156
-
157
-
158
-
159
-
160
-
161
-
162
-
163
-
164
-
165
-
166
-
167
-
168
-
169
-
170
-
171
-
172
-
173
-
174
-
175
-
176
-
177
-
178
 |
 |

YUM! BRANDS, INC.-2013 Form10-K20
Form 10-K
PART II
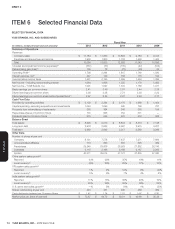
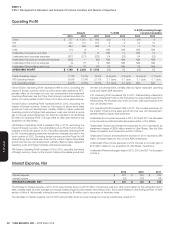
ITEM7Management’s Discussion and Analysis of Financial Condition and Results of Operations
from suppliers. As a result of increased product testing and additional
regulatory scrutiny, instances of supplier noncompliance are identified
from time to time, leading to related actions by us and regulatory
authorities, including the termination of certain suppliers in accordance
with our policies.
KFC China sales were further negatively impacted beginning in April of
2013 by the intense media surrounding avian flu in China. The combined
impacts of the media attention surrounding the SFDA investigation and
avian flu resulted in a 13% decline in China Division same-store sales
for the full year. Operating Profit for 2013 declined 26%, prior to foreign
currency translation, due primarily to sales de-leverage at KFC.
As the extensive publicity in 2013 around these two events subsided, KFC
China’s sales began to recover, and same-store sales improved in each
consecutive month during China Division’s fourth quarter. KFC China’s
fourth quarter same-store sales declined 4% compared to same store
sales declines of 15% for the full year.
Given the momentum of the KFC business and the continued strength of
Pizza Hut Casual Dining, China Division 2014 Operating Profit is expected
to return to 2012 levels of more than $1 billion.
In light of increased attention on food safety issues in China generally,
and on poultry supply in particular, as well as recent reports of avian flu in
China, further reports relating to either issue could have a material adverse
effect on our sales and results of operations for our China Division. See
Item IA “Risk Factors” on page 6 for a discussion of risks relating to food
safety and avian flu.
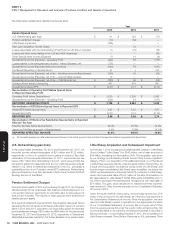
Extra Week in 2011
Our fiscal calendar results in a 53
rd
week every five or six years. Fiscal year
2011 included a 53
rd
week in the fourth quarter for all our U.S. businesses
and certain of our YRI businesses that report on a period, as opposed to
a monthly, basis. Our China and India Divisions report on a monthly basis
and thus did not have a 53rdweek in 2011.
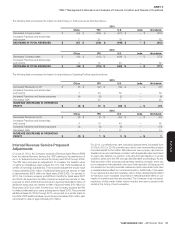
See the System Sales Growth section within our MD&A for further discussion on the impact of 53rdweek in 2011 on system sales. The following table
summarizes the estimated impact of the 53rdweek in 2011 on revenues and Operating Profit:
U.S. YRI Unallocated Total
Revenues
Company sales $ 43 $ 29 $ — $ 72
Franchise and license fees 13 6 — 19
Total Revenues $ 56 $ 35 $ — $ 91
Operating Profit
Franchise and license fees $ 13 $ 6 $ — $ 19
Restaurant profit 9 6 — 15
General and administrative expenses (4) (4) (1) (9)
Operating Profit(a) $ 18 $ 8 $ (1) $ 25
(a) The $25 million benefit was offset throughout 2011 by investments, including franchise development incentives, as well as higher-than-normal spending, such as restaurant closures in the
U.S. and YRI.
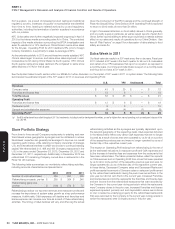
Store Portfolio Strategy
From time to time we sell Company restaurants to existing and new
franchisees where geographic synergies can be obtained or where
franchisees’ expertise can generally be leveraged to improve our overall
operating performance, while retaining Company ownership of strategic
U.S. and international markets in which we choose to continue investing
capital. We refranchised 214, 468 and 404 Company restaurants in the
U.S. in the years ended December 28, 2013, December 29, 2012 and
December 31, 2011, respectively. Additionally, in December 2012 we
refranchised 331 remaining Company-owned dine-in restaurants in the
Pizza Hut UK business.
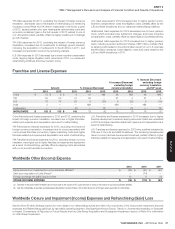
The following table summarizes our worldwide refranchising activities,
including amounts characterized as Special Items:
2013 2012 2011
Number of units refranchised 286 897 529
Refranchising proceeds, pre-tax $ 260 $ 364 $ 246
Refranchising (gain) loss,
pre-tax $ (100) $ (78) $ 72
Refranchisings reduce our reported revenues and restaurant profits and
increase the importance of system sales growth as a key performance
measure. Additionally, G&A expenses will decline and franchise and
license expense can increase over time as a result of these refranchising
activities. The timing of G&A declines will vary and often lag the actual
refranchising activities as the synergies are typically dependent upon
the size and geography of the respective deals. G&A expenses included
in the tables below reflect only direct G&A expenses that we no longer
incurred as a result of stores that were operated by us for all or a portion
of the respective previous year and were no longer operated by us as of
the last day of the respective current year.
The impact on Operating Profit arising from refranchising is the net of
(a)the estimated reductions in restaurant profit and G&A expenses and
(b) the increase in franchise fees and expenses from the restaurants that
have been refranchised. The tables presented below reflect the impacts
on Total revenues and on Operating Profit from stores that were operated
by us for all or some portion of the respective previous year and were no
longer operated by us as of the last day of the respective current year.
In these tables, Decreased Company sales and Decreased Restaurant
profit represents the amount of Company sales or restaurant profit earned
by the refranchised restaurants during the period we owned them in the
prior year but did not own them in the current year. Increased Franchise
and license fees and income represents the franchise and license fees
and rent income from the refranchised restaurants that were recorded by
the Company in the current year during periods in which the restaurants
were Company stores in the prior year. Increased Franchise and license
expenses represent primarily rent and depreciation where we continue
to own or lease the underlying property for the refranchised restaurants
that were recorded by the Company in the current year during periods in
which the restaurants were Company stores in the prior year.