Pizza Hut 2013 Annual Report Download - page 147
Download and view the complete annual report
Please find page 147 of the 2013 Pizza Hut annual report below. You can navigate through the pages in the report by either clicking on the pages listed below, or by using the keyword search tool below to find specific information within the annual report.-
 1
1 -
2
-
3
-
4
-
5
-
6
-
7
-
8
-
9
-
10
-
11
-
12
-
13
-
14
-
15
-
16
-
17
-
18
-
19
-
20
-
21
-
22
-
23
-
24
-
25
-
26
-
27
-
28
-
29
-
30
-
31
-
32
-
33
-
34
-
35
-
36
-
37
-
38
-
39
-
40
-
41
-
42
-
43
-
44
-
45
-
46
-
47
-
48
-
49
-
50
-
51
-
52
-
53
-
54
-
55
-
56
-
57
-
58
-
59
-
60
-
61
-
62
-
63
-
64
-
65
-
66
-
67
-
68
-
69
-
70
-
71
-
72
-
73
-
74
-
75
-
76
-
77
-
78
-
79
-
80
-
81
-
82
-
83
-
84
-
85
-
86
-
87
-
88
-
89
-
90
-
91
-
92
-
93
-
94
-
95
-
96
-
97
-
98
-
99
-
100
-
101
-
102
-
103
-
104
-
105
-
106
-
107
-
108
-
109
-
110
-
111
-
112
-
113
-
114
-
115
-
116
-
117
-
118
-
119
-
120
-
121
-
122
-
123
-
124
-
125
-
126
-
127
-
128
-
129
-
130
-
131
-
132
-
133
-
134
-
135
-
136
-
 137
137 -
 138
138 -
 139
139 -
 140
140 -
 141
141 -
 142
142 -
 143
143 -
 144
144 -
 145
145 -
 146
146 -
 147
147 -
 148
148 -
 149
149 -
 150
150 -
 151
151 -
 152
152 -
 153
153 -
 154
154 -
 155
155 -
 156
156 -
 157
157 -
158
-
159
-
160
-
161
-
162
-
163
-
164
-
165
-
166
-
167
-
168
-
169
-
170
-
171
-
172
-
173
-
174
-
175
-
176
-
177
-
178
 |
 |

YUM! BRANDS, INC.-2013 Form10-K 51
Form 10-K
PART II
ITEM 8Financial Statements andSupplementaryData
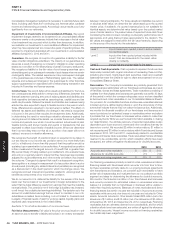
Store Closure and Impairment Activity
Store closure (income) costs and Store impairment charges by reportable segment are presented below. These tables exclude $295 million of Little Sheep
impairment losses in 2013 and $80 million of net losses related to the LJS and A&W divestitures in 2011, which were not allocated to any segment for
performance reporting purposes.
2013
China YRI U.S. India Worldwide
Store closure (income) costs(a) $ (1) $ (4) $ — $ — $ (5)
Store impairment charges 31 3 5 2 41
CLOSURE AND IMPAIRMENT (INCOME) EXPENSES $ 30 $ (1) $ 5 $ 2 $ 36
2012
China YRI U.S. India Worldwide
Store closure (income) costs(a) $ (4) $ 12 $ — $ — $ 8
Store impairment charges 13 7 9 — 29
CLOSURE AND IMPAIRMENT (INCOME) EXPENSES $ 9 $ 19 $ 9 $ — $ 37
2011
China YRI U.S. India Worldwide
Store closure (income) costs(a) $ (1) $ 4 $ 4 $ — $ 7
Store impairment charges 13 18 17 — 48
CLOSURE AND IMPAIRMENT (INCOME) EXPENSES $ 12 $ 22 $ 21 $ — $ 55
(a) Store closure (income) costs include the net gain or loss on sales of real estate on which we formerly operated a Company-owned restaurant that was closed, lease reserves established
when we cease using a property under an operating lease and subsequent adjustments to those reserves and other facility-related expenses from previously closed stores.
The following table summarizes the 2013 and 2012 activity related to reserves for remaining lease obligations for closed stores.
Beginning
Balance
Amounts
Used
New
Decisions
Estimate/
Decision
Changes CTA/Other Ending Balance
2013 Activity $ 27 (11) 1 4 — $ 21
2012 Activity $ 34 (14) 3 3 1 $ 27
Changes in our Effective Tax Rate
For 2013 our effective tax rate was 6.4 percentage points higher than 2012. See Note 17 for further discussion of our effective tax rate.
NOTE5 Supplemental Cash Flow Data
2013 2012 2011
Cash Paid For:
Interest(a) $ 269 $ 166 $ 199
Income taxes 489 417 349
Significant Non-Cash Investing and Financing Activities:
Capital lease obligations incurred $ 15 $ 17 $ 58
Capital lease obligations relieved, primarily through divestitures and refranchisings 2 112 65
Increase (decrease) in accrued capital expenditures (41) 35 55
(a) 2013 includes $109 million of cash premiums and fees paid related to the extinguishment of debt, which is the primary component of the $120 million loss on debt extinguishment which
was not allocated for performance reporting purposes. See the Losses Related to the Extinguishment of Debt section of Note 4 for details.