Pizza Hut 2013 Annual Report Download - page 162
Download and view the complete annual report
Please find page 162 of the 2013 Pizza Hut annual report below. You can navigate through the pages in the report by either clicking on the pages listed below, or by using the keyword search tool below to find specific information within the annual report.-
 1
1 -
2
-
3
-
4
-
5
-
6
-
7
-
8
-
9
-
10
-
11
-
12
-
13
-
14
-
15
-
16
-
17
-
18
-
19
-
20
-
21
-
22
-
23
-
24
-
25
-
26
-
27
-
28
-
29
-
30
-
31
-
32
-
33
-
34
-
35
-
36
-
37
-
38
-
39
-
40
-
41
-
42
-
43
-
44
-
45
-
46
-
47
-
48
-
49
-
50
-
51
-
52
-
53
-
54
-
55
-
56
-
57
-
58
-
59
-
60
-
61
-
62
-
63
-
64
-
65
-
66
-
67
-
68
-
69
-
70
-
71
-
72
-
73
-
74
-
75
-
76
-
77
-
78
-
79
-
80
-
81
-
82
-
83
-
84
-
85
-
86
-
87
-
88
-
89
-
90
-
91
-
92
-
93
-
94
-
95
-
96
-
97
-
98
-
99
-
100
-
101
-
102
-
103
-
104
-
105
-
106
-
107
-
108
-
109
-
110
-
111
-
112
-
113
-
114
-
115
-
116
-
117
-
118
-
119
-
120
-
121
-
122
-
123
-
124
-
125
-
126
-
127
-
128
-
129
-
130
-
131
-
132
-
133
-
134
-
135
-
136
-
137
-
138
-
139
-
140
-
141
-
142
-
143
-
144
-
145
-
146
-
147
-
148
-
149
-
150
-
151
-
 152
152 -
 153
153 -
 154
154 -
 155
155 -
 156
156 -
 157
157 -
 158
158 -
 159
159 -
 160
160 -
 161
161 -
 162
162 -
 163
163 -
 164
164 -
 165
165 -
 166
166 -
 167
167 -
 168
168 -
 169
169 -
 170
170 -
 171
171 -
 172
172 -
173
-
174
-
175
-
176
-
177
-
178
 |
 |

YUM! BRANDS, INC.-2013 Form10-K66
Form 10-K
PART II
ITEM 8Financial Statements andSupplementaryData
The Company believes it is reasonably possible its unrecognized tax
benefits may decrease by approximately $26 million in the next twelve
months, including approximately $20 million which, if recognized upon
audit settlement or statute expiration, would affect the 2014 effective tax
rate. Each of these positions is individually insignificant.
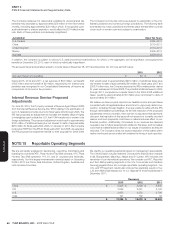
The Company’s income tax returns are subject to examination in the U.S.
federal jurisdiction and numerous foreign jurisdictions. The following table
summarizes our major jurisdictions and the tax years that are either currently
under audit or remain open and subject to examination:
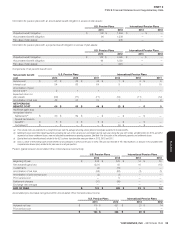
Jurisdiction Open Tax Years
U.S. Federal 2004–2013
China 2010–2013
United Kingdom 2010–2013
Mexico 2006–2013
Australia 2009–2013
In addition, the Company is subject to various U.S. state income tax examinations, for which, in the aggregate, we had significant unrecognized tax
benefits at December 28, 2013, each of which is individually insignificant.
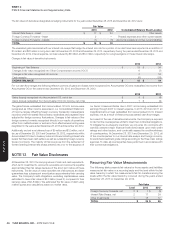
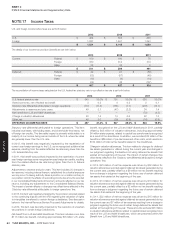
The accrued interest and penalties related to income taxes at December 28, 2013 and December 29, 2012 are set forth below:
2013 2012
Accrued interest and penalties $ 64 $ 50
During 2013, 2012 and 2011, a net expense of $18 million, net benefit
of $3 million and net benefit of $2 million, respectively, for interest and
penalties was recognized in our Consolidated Statements of Income as
components of its income tax provision.
Internal Revenue Service Proposed
Adjustments
On June 23, 2010, the Company received a Revenue Agent Report (RAR)
from the Internal Revenue Service (the “IRS”) relating to its examination of
our U.S. federal income tax returns for fiscal years 2004 through 2006. The
IRS has proposed an adjustment to increase the taxable value of rights
to intangibles used outside the U.S. that YUM transferred to certain of its
foreign subsidiaries. The proposed adjustment would result in approximately
$700 million of additional taxes plus net interest to date of approximately
$255 million for fiscal years 2004-2006. On January 9, 2013, the Company
received an RAR from the IRS for fiscal years 2007 and 2008. As expected,
the IRS proposed an adjustment similar to their proposal for 2004-2006
that would result in approximately $270 million of additional taxes plus
net interest to date of approximately $40 million for fiscal years 2007 and
2008. Furthermore, the Company expects the IRS to make similar claims
for years subsequent to fiscal 2008. The potential additional taxes for 2009
through 2013, computed on a similar basis to the 2004-2008 additional
taxes, would be approximately $140 million plus net interest to date of
approximately $10 million.
We believe we have properly reported our taxable income and paid taxes
consistent with all applicable laws and intend to vigorously defend our
position, including through litigation, if we are unable to settle with the IRS
through administrative proceedings. As the final resolution of the proposed
adjustments remains uncertain, there can be no assurance that payments
due upon final resolution of this issue will not exceed our currently recorded
reserve and such payments could have a material adverse effect on our
financial position. Additionally, if increases to our reserves are deemed
necessary due to future developments related to this issue, such increases
could have a material adverse effect on our results of operations as they are
recorded. The Company does not expect resolution of this matter within
twelve months and cannot predict with certainty the timing of such resolution.
NOTE18 Reportable Operating Segments
We are principally engaged in developing, operating, franchising and
licensing the worldwide KFC, Pizza Hut and Taco Bell concepts. KFC, Pizza
Hut and Taco Bell operate in 118, 91, and 21 countries and territories,
respectively. Our five largest international markets based on Operating
Profit in 2013 are China, Asia Franchise, United Kingdom, Australia and
Latin America Franchise.
We identify our operating segments based on management responsibility.
The China Division includes mainland China and the India Division includes
India, Bangladesh, Mauritius, Nepal and Sri Lanka. YRI includes the
remainder of our international operations. We consider our KFC, Pizza Hut
and Taco Bell operating segments in the U.S. to be similar and therefore
have aggregated them into a single reportable operating segment. Our
U.S. and YRI segment results also include the operating results of our
LJS and A&W businesses prior to our disposal of those businesses in
December 2011.
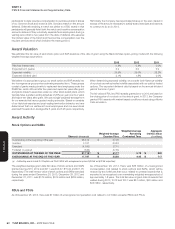
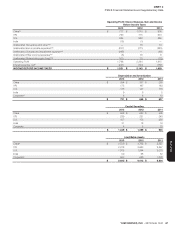
Revenues
2013 2012 2011
China $ 6,905 $ 6,898 $ 5,566
YRI 3,099 3,281 3,192
U.S. 2,953 3,352 3,786
India 127 102 82
$ 13,084 $ 13,633 $ 12,626