Pizza Hut 2013 Annual Report Download - page 121
Download and view the complete annual report
Please find page 121 of the 2013 Pizza Hut annual report below. You can navigate through the pages in the report by either clicking on the pages listed below, or by using the keyword search tool below to find specific information within the annual report.-
 1
1 -
2
-
3
-
4
-
5
-
6
-
7
-
8
-
9
-
10
-
11
-
12
-
13
-
14
-
15
-
16
-
17
-
18
-
19
-
20
-
21
-
22
-
23
-
24
-
25
-
26
-
27
-
28
-
29
-
30
-
31
-
32
-
33
-
34
-
35
-
36
-
37
-
38
-
39
-
40
-
41
-
42
-
43
-
44
-
45
-
46
-
47
-
48
-
49
-
50
-
51
-
52
-
53
-
54
-
55
-
56
-
57
-
58
-
59
-
60
-
61
-
62
-
63
-
64
-
65
-
66
-
67
-
68
-
69
-
70
-
71
-
72
-
73
-
74
-
75
-
76
-
77
-
78
-
79
-
80
-
81
-
82
-
83
-
84
-
85
-
86
-
87
-
88
-
89
-
90
-
91
-
92
-
93
-
94
-
95
-
96
-
97
-
98
-
99
-
100
-
101
-
102
-
103
-
104
-
105
-
106
-
107
-
108
-
109
-
110
-
 111
111 -
 112
112 -
 113
113 -
 114
114 -
 115
115 -
 116
116 -
 117
117 -
 118
118 -
 119
119 -
 120
120 -
 121
121 -
 122
122 -
 123
123 -
 124
124 -
 125
125 -
 126
126 -
 127
127 -
 128
128 -
 129
129 -
 130
130 -
 131
131 -
132
-
133
-
134
-
135
-
136
-
137
-
138
-
139
-
140
-
141
-
142
-
143
-
144
-
145
-
146
-
147
-
148
-
149
-
150
-
151
-
152
-
153
-
154
-
155
-
156
-
157
-
158
-
159
-
160
-
161
-
162
-
163
-
164
-
165
-
166
-
167
-
168
-
169
-
170
-
171
-
172
-
173
-
174
-
175
-
176
-
177
-
178
 |
 |

YUM! BRANDS, INC.-2013 Form10-K 25
Form 10-K
PART II
ITEM7Management’s Discussion and Analysis of Financial Condition and Results of Operations
Income/(Expense)
2012 vs. 2011
2011
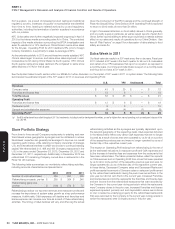
Store Portfolio
Actions Other FX 2012
Company sales $ 5,487 $ 910 $ 249 $ 151 $ 6,797
Cost of sales (1,947) (318) 3 (50) (2,312)
Cost of labor (890) (207) (134) (28) (1,259)
Occupancy and other (1,568) (336) (45) (44) (1,993)
RESTAURANT PROFIT $ 1,082 $ 49 $ 73 $ 29 $ 1,233
Restaurant margin 19.7% 18.1%
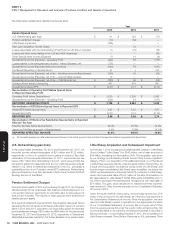
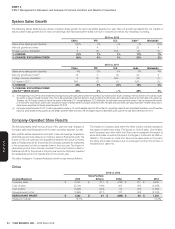
In 2013, the increase in China Company sales and Restaurant profit
associated with store portfolio actions was driven by new unit development
and the 2012 acquisition of Little Sheep, partially offset by restaurant closures.
Significant other factors impacting Company sales and/or Restaurant profit
were Company same-store sales declines of 12% and the impact of wage
rate inflation of 7%, partially offset by restaurant operating efficiencies.
In 2012, the increase in China Company sales associated with store portfolio
actions was primarily driven by new unit development and the acquisition
of Little Sheep, partially offset by restaurant closures. The increase in China
Restaurant profit associated with store portfolio actions was primarily
driven by new unit development, partially offset by restaurant closures.
Significant other factors impacting Company sales and/or Restaurant profit
were Company same-store sales growth of 4%, which was partially offset
by wage rate inflation of 10% and higher rent and utilities�
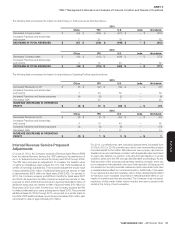
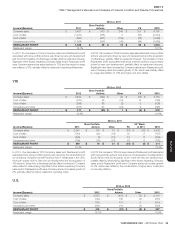
YRI
Income/(Expense)
2013 vs. 2012
2012
Store Portfolio
Actions Other FX 2013
Company sales $ 2,402 $ (252) $ 42 $ (33) $ 2,159
Cost of sales (787) 39 (15) 15 (748)
Cost of labor (599) 88 (2) 5 (508)
Occupancy and other (705) 95 (24) 9 (625)
RESTAURANT PROFIT $ 311 $ (30) $ 1 $ (4) $ 278
Restaurant margin 12�9% 12�9%
Income/(Expense)
2012 vs. 2011
2011
Store Portfolio
Actions Other FX
53rd Week
in 2011 2012
Company sales $ 2,341 $ 100 $ 72 $ (82) $ (29) $ 2,402
Cost of sales (743) (65) (18) 30 9 (787)
Cost of labor (608) (3) (15) 19 8 (599)
Occupancy and other (700) (16) (18) 23 6 (705)
RESTAURANT PROFIT $ 290 $ 16 $ 21 $ (10) $ (6) $ 311
Restaurant margin 12�4% 12�9%
In 2013, the decrease in YRI Company sales and Restaurant profit
associated with store portfolio actions was driven by the refranchising of
our remaining Company-owned Pizza Hut dine-in restaurants in the UK in
the fourth quarter of 2012. Net new unit development and the acquisition of
106 stores in Turkey from a franchisee partially offset the decline in Company
sales related to refranchising. Significant other factors impacting Company
sales and/or Restaurant profit were Company same-store sales growth of
2%, partially offset by higher restaurant operating costs.
In 2012, the increase in YRI Company sales and Restaurant profit associated
with store portfolio actions was driven by the acquisition of restaurants in
South Africa in the fourth quarter of 2011 and net new unit development,
partially offset by refranchising. Significant other factors impacting Company
sales and/or Restaurant profit were Company same-store sales growth
of 3%, which was offset by the combination of higher labor costs and
commodity inflation�
U.S.
Income/(Expense)
2013 vs. 2012
2012
Store Portfolio
Actions Other 2013
Company sales $ 2,550 $ (431) $ (3) $ 2,116
Cost of sales (740) 130 (5) (615)
Cost of labor (751) 131 5 (615)
Occupancy and other (643) 119 (5) (529)
RESTAURANT PROFIT $ 416 $ (51) $ (8) $ 357
Restaurant margin 16�3% 16�9%