Pizza Hut 2013 Annual Report Download - page 112
Download and view the complete annual report
Please find page 112 of the 2013 Pizza Hut annual report below. You can navigate through the pages in the report by either clicking on the pages listed below, or by using the keyword search tool below to find specific information within the annual report.-
 1
1 -
2
-
3
-
4
-
5
-
6
-
7
-
8
-
9
-
10
-
11
-
12
-
13
-
14
-
15
-
16
-
17
-
18
-
19
-
20
-
21
-
22
-
23
-
24
-
25
-
26
-
27
-
28
-
29
-
30
-
31
-
32
-
33
-
34
-
35
-
36
-
37
-
38
-
39
-
40
-
41
-
42
-
43
-
44
-
45
-
46
-
47
-
48
-
49
-
50
-
51
-
52
-
53
-
54
-
55
-
56
-
57
-
58
-
59
-
60
-
61
-
62
-
63
-
64
-
65
-
66
-
67
-
68
-
69
-
70
-
71
-
72
-
73
-
74
-
75
-
76
-
77
-
78
-
79
-
80
-
81
-
82
-
83
-
84
-
85
-
86
-
87
-
88
-
89
-
90
-
91
-
92
-
93
-
94
-
95
-
96
-
97
-
98
-
99
-
100
-
101
-
 102
102 -
 103
103 -
 104
104 -
 105
105 -
 106
106 -
 107
107 -
 108
108 -
 109
109 -
 110
110 -
 111
111 -
 112
112 -
 113
113 -
 114
114 -
 115
115 -
 116
116 -
 117
117 -
 118
118 -
 119
119 -
 120
120 -
 121
121 -
 122
122 -
123
-
124
-
125
-
126
-
127
-
128
-
129
-
130
-
131
-
132
-
133
-
134
-
135
-
136
-
137
-
138
-
139
-
140
-
141
-
142
-
143
-
144
-
145
-
146
-
147
-
148
-
149
-
150
-
151
-
152
-
153
-
154
-
155
-
156
-
157
-
158
-
159
-
160
-
161
-
162
-
163
-
164
-
165
-
166
-
167
-
168
-
169
-
170
-
171
-
172
-
173
-
174
-
175
-
176
-
177
-
178
 |
 |

YUM! BRANDS, INC.-2013 Form10-K16
Form 10-K
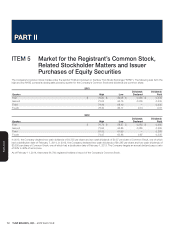
PART II
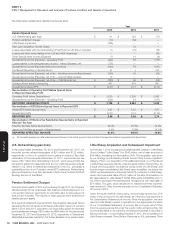
ITEM7Management’s Discussion and Analysis of Financial Condition and Results of Operations
As of and through December 28, 2013, YUM’s business consists of
four reporting segments: YUM China (“China” or “China Division”), YUM
Restaurants International (“YRI” or “International Division”), United States
(“U.S.”) and YUM Restaurants India (“India” or “India Division”). The China
Division includes mainland China and the India Division includes India,
Bangladesh, Mauritius, Nepal and Sri Lanka. YRI includes the remainder
of our international operations. The China Division, YRI and Taco Bell
U.S. represent approximately 90% of the Company’s operating profits,
excluding Corporate and unallocated income and expenses.
In the first quarter of 2014, we will combine our YRI and U.S. businesses
and begin reporting segment information for three global divisions: KFC,
Pizza Hut and Taco Bell. China and India will remain separate reporting
segments due to their strategic importance and growth potential. This
new structure is designed to drive greater global brand focus, enabling
us to more effectively share know-how and accelerate growth. While our
consolidated results will not be impacted, we will restate our historical
segment information during 2014 for consistent presentation.
In 2012, our India Division began being reported as a standalone reporting
segment separate from YRI as a result of changes to our management
reporting structure. While our consolidated results are not impacted, our
historical segment information has been restated to be consistent with
the current period presentation.
In December of 2011 we sold our Long John Silver’s (“LJS”) and A&W All
American Food Restaurants (“A&W”) brands to key franchise leaders and
strategic investors in separate transactions. The results for these businesses
through the sale dates are included in the Company’s results for 2011.
Strategies
The Company has historically focused on the following four key strategies:
Build Leading Brands in China in Every Significant Category– The
Company has developed the KFC and Pizza Hut brands into the leading
quick service and casual dining restaurant brands, respectively, in mainland
China.Additionally, the Company owns and operates the distribution
system for its restaurants in China which we believe provides a significant
competitive advantage.Given this strong competitive position, a growing
economy and a population of 1.4 billion in mainland China, the Company is
rapidly adding KFC and Pizza Hut Casual Dining restaurants, beginning to
develop Pizza Hut Home Service (home delivery) and testing the additional
restaurant concept of East Dawning (Chinese food).Additionally, on
February 1, 2012 we acquired an additional 66% interest in Little Sheep
Group Ltd. (“Little Sheep”), a leading casual dining concept in China.
This acquisition brought our total ownership to approximately 93% of
the business. Our ongoing earnings growth model in China includes low
double-digit percentage unit growth, mid-single digit same-store sales
growth and moderate margin improvement, which we expect to drive
Operating Profit growth of 15%.
Drive Aggressive International Expansion and Build Strong Brands
Everywhere– Outside the U.S. and China the Company and its franchisees
opened over 1,200 new restaurants in 2013, representing 14 straight years
of opening over 700 restaurants, and the Company is one of the leading
international retail developers in terms of units opened.The Company
expects to continue to experience strong growth by building out existing
markets and growing in new markets including India, France, Germany,
Russia and across Africa.The International Division’s Operating Profit has
experienced a 10-year compound annual growth rate of approximately
12%.Our ongoing earnings growth model for YRI includes Operating
Profit growth of 10% driven by 3-4% unit growth, system sales growth
of 6%, at least 2-3% same-store sales growth, margin improvement and
leverage of our G&A infrastructure.
Dramatically Improve U.S. Brand Positions, Consistency and
Returns– The Company continues to focus on improving its U.S. position
through differentiated products and marketing and an improved customer
experience.The Company also strives to provide industry-leading new
product innovation which adds sales layers and expands day parts.We
continue to evaluate our returns and ownership positions with an earn-
the-right-to-own philosophy on Company-owned restaurants.Our ongoing
earnings growth model for the U.S. calls for Operating Profit growth of 5%
driven by same-store sales growth of at least 2%, margin improvement
and leverage of our G&A infrastructure.
Drive Industry-Leading, Long-Term Shareholder and Franchisee Value–
The Company is focused on delivering high returns and returning substantial
cash flows to its shareholders via dividends and share repurchases.The
Company has one of the highest returns on invested capital in the QSR
industry.The Company’s dividend and share repurchase programs have
returned over $3.3 billion and $8.5 billion to shareholders, respectively,
since 2004.The Company targets an annual dividend payout ratio of
35% to 40% of net income and has increased the quarterly dividend at
a double-digit percentage rate each year since first initiating a dividend
in 2004.Shares are repurchased opportunistically as part of our regular
capital structure decisions.
Our ongoing earnings growth model, including the components above,
is expected to generate EPS growth of at least 10% annually. However,
due primarily to poor performance in our China Division, the Company’s
2013 EPS prior to Special Items declined 9%. Our 2014 EPS prior to
Special Items is expected to grow at least 20% due in large part to our
expectations that China Division Operating Profit for 2014 will grow at a
rate significantly above the ongoing growth rate of 15% indicated above.
2013 Highlights
•
KFC China sales and profits were significantly impacted by the effects
of the December 2012 poultry supply incident, as well as subsequent
news of avian flu.
•
Worldwide system sales grew 2%, prior to foreign currency translation,
including 5% growth at YRI and 1% growth in the U.S. System sales
declined 4% in China.
•
Same-store sales declined 13% in China. Same-store sales grew 1%
at YRI and were flat in the U.S.
•Total international development was 1,952 new restaurants.
•
Worldwide restaurant margin declined 1.6 percentage points to 15.0%,
including a decline of 2.7 percentage points in China. Restaurant margin
was even at YRI and increased 0.6 percentage points in the U.S.
•
Worldwide operating profit declined 10%, prior to foreign currency
translation, including a decline of 26% in China. Operating profit grew
10% at YRI and 3% in the U.S.
•
Worldwide effective tax rate increased to 28.0% from 25.8%, driven
primarily by a tax reserve adjustment in the third quarter. The tax rate
increase negatively impacted 2013 EPS results by 3 percentage points.
•
A non-cash, Special Items net charge of $258 million related to the
write-down of Little Sheep intangible assets was recorded in the third
quarter. This charge impacted reported EPS by 16 percentage points
for the full year.
•
The Company repurchased $550 million of outstanding debt in the
fourth quarter and recorded a Special Items net charge of approximately
$75 million, primarily due to premiums paid related to this transaction. This
charge impacted reported EPS by 5 percentage points for the full year.
All preceding comparisons are versus the same period a year ago
and exclude the impact of Special Items unless otherwise noted. See
the Significant Known Events, Trends or Uncertainties Impacting or
Expected to Impact Comparisons of Reported or Future Results section
of this MD&A for a description of Special Items.