Pizza Hut 2013 Annual Report Download - page 108
Download and view the complete annual report
Please find page 108 of the 2013 Pizza Hut annual report below. You can navigate through the pages in the report by either clicking on the pages listed below, or by using the keyword search tool below to find specific information within the annual report.-
 1
1 -
2
-
3
-
4
-
5
-
6
-
7
-
8
-
9
-
10
-
11
-
12
-
13
-
14
-
15
-
16
-
17
-
18
-
19
-
20
-
21
-
22
-
23
-
24
-
25
-
26
-
27
-
28
-
29
-
30
-
31
-
32
-
33
-
34
-
35
-
36
-
37
-
38
-
39
-
40
-
41
-
42
-
43
-
44
-
45
-
46
-
47
-
48
-
49
-
50
-
51
-
52
-
53
-
54
-
55
-
56
-
57
-
58
-
59
-
60
-
61
-
62
-
63
-
64
-
65
-
66
-
67
-
68
-
69
-
70
-
71
-
72
-
73
-
74
-
75
-
76
-
77
-
78
-
79
-
80
-
81
-
82
-
83
-
84
-
85
-
86
-
87
-
88
-
89
-
90
-
91
-
92
-
93
-
94
-
95
-
96
-
97
-
 98
98 -
 99
99 -
 100
100 -
 101
101 -
 102
102 -
 103
103 -
 104
104 -
 105
105 -
 106
106 -
 107
107 -
 108
108 -
 109
109 -
 110
110 -
 111
111 -
 112
112 -
 113
113 -
 114
114 -
 115
115 -
 116
116 -
 117
117 -
 118
118 -
119
-
120
-
121
-
122
-
123
-
124
-
125
-
126
-
127
-
128
-
129
-
130
-
131
-
132
-
133
-
134
-
135
-
136
-
137
-
138
-
139
-
140
-
141
-
142
-
143
-
144
-
145
-
146
-
147
-
148
-
149
-
150
-
151
-
152
-
153
-
154
-
155
-
156
-
157
-
158
-
159
-
160
-
161
-
162
-
163
-
164
-
165
-
166
-
167
-
168
-
169
-
170
-
171
-
172
-
173
-
174
-
175
-
176
-
177
-
178
 |
 |

YUM! BRANDS, INC.-2013 Form10-K12
Form 10-K
PART II
ITEM 5Market for the Registrant’s Common Stock, Related Stockholder Matters and Issuer Purchases of Equity Securities
PART II
ITEM 5 Market for the Registrant’s Common Stock,
Related Stockholder Matters and Issuer
Purchases of Equity Securities
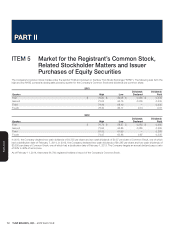
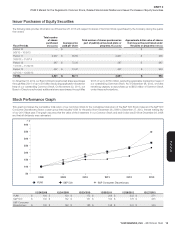
The Company’s Common Stock trades under the symbol YUM and is listed on the New York Stock Exchange (“NYSE”). The following sets forth the
high and low NYSE composite closing sale prices by quarter for the Company’s Common Stock and dividends per common share.
2013
Quarter High Low
Dividends
Declared
Dividends
Paid
First $ 70.20 $ 62.08 $ 0.335 $ 0.335
Second 73.52 64.15 0.335 0.335
Third 74.82 68.10 — 0.335
Fourth 78.30 65.17 0.74 0.37
2012
Quarter High Low
Dividends
Declared
Dividends
Paid
First $ 70.72 $ 58.57 $ 0.285 $ 0.285
Second 73.93 62.86 0.285 0.285
Third 67.53 61.95 — 0.285
Fourth 74.47 63.88 0.67 0.335
In 2013, the Company declared two cash dividends of $0.335 per share and two cash dividends of $0.37 per share of Common Stock, one of which
had a distribution date of February 7, 2014. In 2012, the Company declared two cash dividends of $0.285 per share and two cash dividends of
$0.335 per share of Common Stock, one of which had a distribution date of February 1, 2013. The Company targets an annual dividend payout ratio
of 35% to 40% of net income.
As of February 11, 2014, there were 61,700 registered holders of record of the Company’s Common Stock.