Pizza Hut 2013 Annual Report Download - page 54
Download and view the complete annual report
Please find page 54 of the 2013 Pizza Hut annual report below. You can navigate through the pages in the report by either clicking on the pages listed below, or by using the keyword search tool below to find specific information within the annual report.-
 1
1 -
2
-
3
-
4
-
5
-
6
-
7
-
8
-
9
-
10
-
11
-
12
-
13
-
14
-
15
-
16
-
17
-
18
-
19
-
20
-
21
-
22
-
23
-
24
-
25
-
26
-
27
-
28
-
29
-
30
-
31
-
32
-
33
-
34
-
35
-
36
-
37
-
38
-
39
-
40
-
41
-
42
-
43
-
 44
44 -
 45
45 -
 46
46 -
 47
47 -
 48
48 -
 49
49 -
 50
50 -
 51
51 -
 52
52 -
 53
53 -
 54
54 -
 55
55 -
 56
56 -
 57
57 -
 58
58 -
 59
59 -
 60
60 -
 61
61 -
 62
62 -
 63
63 -
 64
64 -
65
-
66
-
67
-
68
-
69
-
70
-
71
-
72
-
73
-
74
-
75
-
76
-
77
-
78
-
79
-
80
-
81
-
82
-
83
-
84
-
85
-
86
-
87
-
88
-
89
-
90
-
91
-
92
-
93
-
94
-
95
-
96
-
97
-
98
-
99
-
100
-
101
-
102
-
103
-
104
-
105
-
106
-
107
-
108
-
109
-
110
-
111
-
112
-
113
-
114
-
115
-
116
-
117
-
118
-
119
-
120
-
121
-
122
-
123
-
124
-
125
-
126
-
127
-
128
-
129
-
130
-
131
-
132
-
133
-
134
-
135
-
136
-
137
-
138
-
139
-
140
-
141
-
142
-
143
-
144
-
145
-
146
-
147
-
148
-
149
-
150
-
151
-
152
-
153
-
154
-
155
-
156
-
157
-
158
-
159
-
160
-
161
-
162
-
163
-
164
-
165
-
166
-
167
-
168
-
169
-
170
-
171
-
172
-
173
-
174
-
175
-
176
-
177
-
178
 |
 |
YUM! BRANDS, INC.-2014Proxy Statement32
Proxy Statement
EXECUTIVE COMPENSATION
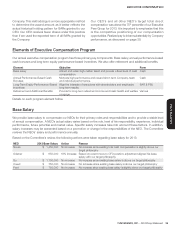
2009 2010 2011 2012 2013
4
3
2
1
0
0
6 000 000
4 000 000
2 000 000
8 000 000
in $ in $
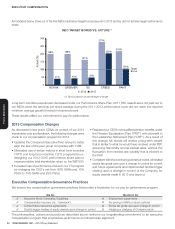
CEO CASH COMPENSATION
(1)
VS. EPS
Base Salary Annual Bonus
(1) Represents our CEO’s base salary and annual bonus for each year
Cash
Compensation EPS
EPS
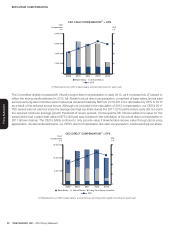
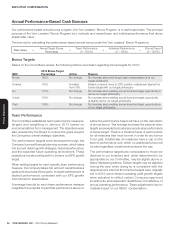
The Committee slightly increased Mr. Novak’s target direct compensation in early 2013, as it increased his LTI award to
reflect the strong results delivered in 2012. Mr. Novak’s actual direct compensation, comprised of base salary, bonus paid
and annual long-term incentive award value has remained relatively flat from 2010-2012 but decreased by 26% in 2013
as a result of his reduced annual bonus. Although not included in the calculation of 2013 compensation, our CEO’s 2011
PSU award was not paid out since the average earnings per share during the 2011-2013 performance cycle did not reach
the required minimum average growth threshold of seven percent. Consequently, Mr. Novak realized no value for the
award which had a grant date value of $773,000 and was included in the calculation of his actual direct compensation in
2011 (shown below). The CEO’s SARs continue to only provide value if shareholders receive value through stock price
appreciation. As demonstrated below, our CEO’s direct compensation, like cash compensation, tracks earnings per share.
2009 2010 2011 2012 2013
4
3
2
1
0
0
10 000 000
5 000 000
15 000 000
Direct
Compensation EPS
in $ in $
CEO DIRECT COMPENSATION(1) VS. EPS
Base Salary Annual Bonus Long-Term Equity Incentive
EPS
(1) Represents our CEO’s base salary, annual bonus, and long-term equity incentive for each year