Pizza Hut 2013 Annual Report Download - page 110
Download and view the complete annual report
Please find page 110 of the 2013 Pizza Hut annual report below. You can navigate through the pages in the report by either clicking on the pages listed below, or by using the keyword search tool below to find specific information within the annual report.-
 1
1 -
2
-
3
-
4
-
5
-
6
-
7
-
8
-
9
-
10
-
11
-
12
-
13
-
14
-
15
-
16
-
17
-
18
-
19
-
20
-
21
-
22
-
23
-
24
-
25
-
26
-
27
-
28
-
29
-
30
-
31
-
32
-
33
-
34
-
35
-
36
-
37
-
38
-
39
-
40
-
41
-
42
-
43
-
44
-
45
-
46
-
47
-
48
-
49
-
50
-
51
-
52
-
53
-
54
-
55
-
56
-
57
-
58
-
59
-
60
-
61
-
62
-
63
-
64
-
65
-
66
-
67
-
68
-
69
-
70
-
71
-
72
-
73
-
74
-
75
-
76
-
77
-
78
-
79
-
80
-
81
-
82
-
83
-
84
-
85
-
86
-
87
-
88
-
89
-
90
-
91
-
92
-
93
-
94
-
95
-
96
-
97
-
98
-
99
-
 100
100 -
 101
101 -
 102
102 -
 103
103 -
 104
104 -
 105
105 -
 106
106 -
 107
107 -
 108
108 -
 109
109 -
 110
110 -
 111
111 -
 112
112 -
 113
113 -
 114
114 -
 115
115 -
 116
116 -
 117
117 -
 118
118 -
 119
119 -
 120
120 -
121
-
122
-
123
-
124
-
125
-
126
-
127
-
128
-
129
-
130
-
131
-
132
-
133
-
134
-
135
-
136
-
137
-
138
-
139
-
140
-
141
-
142
-
143
-
144
-
145
-
146
-
147
-
148
-
149
-
150
-
151
-
152
-
153
-
154
-
155
-
156
-
157
-
158
-
159
-
160
-
161
-
162
-
163
-
164
-
165
-
166
-
167
-
168
-
169
-
170
-
171
-
172
-
173
-
174
-
175
-
176
-
177
-
178
 |
 |

YUM! BRANDS, INC.-2013 Form10-K14
Form 10-K
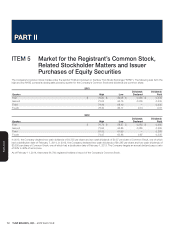
PART II
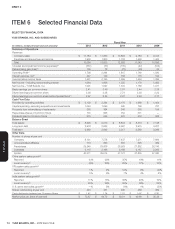
ITEM 6 Selected Financial Data
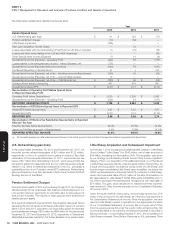
SELECTED FINANCIAL DATA
YUM! BRANDS, INC. AND SUBSIDIARIES
(in millions, except per share and unit amounts)
Fiscal Year
2013 2012 2011 2010 2009
Summary of Operations
Revenues
Company sales $ 11,184 $ 11,833 $ 10,893 $ 9,783 $ 9,413
Franchise and license fees and income 1,900 1,800 1,733 1,560 1,423
Total 13,084 13,633 12,626 11,343 10,836
Closures and impairment income (expenses)(a) (331) (37) (135) (47) (103)
Refranchising gain (loss)(b) 100 78 (72) (63) 26
Operating Profit(c) 1,798 2,294 1,815 1,769 1,590
Interest expense, net(c) 247 149 156 175 194
Income before income taxes 1,551 2,145 1,659 1,594 1,396
Net Income – including noncontrolling interest 1,064 1,608 1,335 1,178 1,083
Net Income – YUM! Brands, Inc. 1,091 1,597 1,319 1,158 1,071
Basic earnings per common share 2.41 3.46 2.81 2.44 2.28
Diluted earnings per common share 2.36 3.38 2.74 2.38 2.22
Diluted earnings per common share before Special Items(c) 2.97 3.25 2.87 2.53 2.17
Cash Flow Data
Provided by operating activities $ 2,139 $ 2,294 $ 2,170 $ 1,968 $ 1,404
Capital spending, excluding acquisitions and investments 1,049 1,099 940 796 797
Proceeds from refranchising of restaurants 260 364 246 265 194
Repurchase shares of Common Stock 770 965 752 371 —
Dividends paid on Common Stock 615 544 481 412 362
Balance Sheet
Total assets $ 8,695 $ 9,013 $ 8,834 $ 8,316 $ 7,148
Long-term debt 2,918 2,932 2,997 2,915 3,207
Total debt 2,989 2,942 3,317 3,588 3,266
Other Data
Number of stores at year end
Company 8,131 7,578 7,437 7,271 7,666
Unconsolidated Affiliates 716 660 587 525 469
Franchisees 29,349 28,608 26,928 27,852 26,745
Licensees 2,115 2,168 2,169 2,187 2,200
System 40,311 39,014 37,121 37,835 37,080
China system sales growth(d)
Reported (1)% 23% 35% 18% 11%
Local currency(e) (4)% 20% 29% 17% 10%
YRI system sales growth(d)
Reported 1% 2% 12% 9% (4)%
Local currency(e) 5% 5% 7% 4% 5%
India system sales growth(d)
Reported 11% 13% 36% 43% 10%
Local currency(e) 20% 29% 35% 36% 24%
U.S. same store sales growth(d) —% 5% (1)% 1% (5)%
Shares outstanding at year end 443 451 460 469 469
Cash dividends declared per Common Share $ 1.41 $ 1.24 $ 1.07 $ 0.92 $ 0.80
Market price per share at year end $ 73.87 $ 64.72 $ 59.01 $ 49.66 $ 35.38