Pizza Hut 2013 Annual Report Download - page 159
Download and view the complete annual report
Please find page 159 of the 2013 Pizza Hut annual report below. You can navigate through the pages in the report by either clicking on the pages listed below, or by using the keyword search tool below to find specific information within the annual report.-
 1
1 -
2
-
3
-
4
-
5
-
6
-
7
-
8
-
9
-
10
-
11
-
12
-
13
-
14
-
15
-
16
-
17
-
18
-
19
-
20
-
21
-
22
-
23
-
24
-
25
-
26
-
27
-
28
-
29
-
30
-
31
-
32
-
33
-
34
-
35
-
36
-
37
-
38
-
39
-
40
-
41
-
42
-
43
-
44
-
45
-
46
-
47
-
48
-
49
-
50
-
51
-
52
-
53
-
54
-
55
-
56
-
57
-
58
-
59
-
60
-
61
-
62
-
63
-
64
-
65
-
66
-
67
-
68
-
69
-
70
-
71
-
72
-
73
-
74
-
75
-
76
-
77
-
78
-
79
-
80
-
81
-
82
-
83
-
84
-
85
-
86
-
87
-
88
-
89
-
90
-
91
-
92
-
93
-
94
-
95
-
96
-
97
-
98
-
99
-
100
-
101
-
102
-
103
-
104
-
105
-
106
-
107
-
108
-
109
-
110
-
111
-
112
-
113
-
114
-
115
-
116
-
117
-
118
-
119
-
120
-
121
-
122
-
123
-
124
-
125
-
126
-
127
-
128
-
129
-
130
-
131
-
132
-
133
-
134
-
135
-
136
-
137
-
138
-
139
-
140
-
141
-
142
-
143
-
144
-
145
-
146
-
147
-
148
-
 149
149 -
 150
150 -
 151
151 -
 152
152 -
 153
153 -
 154
154 -
 155
155 -
 156
156 -
 157
157 -
 158
158 -
 159
159 -
 160
160 -
 161
161 -
 162
162 -
 163
163 -
 164
164 -
 165
165 -
 166
166 -
 167
167 -
 168
168 -
 169
169 -
170
-
171
-
172
-
173
-
174
-
175
-
176
-
177
-
178
 |
 |

YUM! BRANDS, INC.-2013 Form10-K 63
Form 10-K
PART II
ITEM 8Financial Statements andSupplementaryData
Impact on Net Income
The components of share-based compensation expense and the related income tax benefits are shown in the following table:
2013 2012 2011
Options and SARs $ 44 $ 42 $ 49
Restricted Stock Units 6 5 5
Performance Share Units (1) 3 5
TOTAL SHARE-BASED COMPENSATION EXPENSE $ 49 $ 50 $ 59
DEFERRED TAX BENEFIT RECOGNIZED $ 15 $ 15 $ 18
EID compensation expense not share-based $ 11 $ 5 $ 2
Cash received from stock option exercises for 2013, 2012 and 2011, was $37 million, $62 million and $59 million, respectively. Tax benefits realized
on our tax returns from tax deductions associated with share-based compensation for 2013, 2012 and 2011 totaled $65 million, $120 million and
$82 million, respectively.
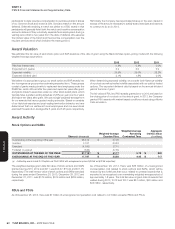
NOTE16 Shareholders’ Equity
Under the authority of our Board of Directors, we repurchased shares of our Common Stock during 2013, 2012 and 2011. All amounts exclude
applicable transaction fees.
Authorization Date
Shares Repurchased (thousands) Dollar Value of Shares Repurchased
2013 2012 2011 2013 2012 2011
November 2013 — — — $ — $ — $ —
November 2012 10,922 1,069 — 750 47 —
November 2011 — 11,035 — — 750 —
January 2011 — 2,787 10,864 — 188 562
March 2010 — — 3,441 — — 171
TOTAL 10,922(a) 14,891(a) 14,305(b) $ 750(a) $ 985(a) $ 733(b)
(a) 2013 amount excludes and 2012 amount includes the effect of $20 million in share repurchases (0.3 million shares) with trade dates prior to the 2012 fiscal year end but with settlement
dates subsequent to the 2012 fiscal year end.
(b) 2011 amount excludes the effect of $19 million in share repurchases (0.4 million shares) with trade dates prior to the 2010 fiscal year end but cash settlement dates subsequent to the
2010 fiscal year.
On November 16, 2012, our Board of Directors authorized share repurchases
through May 2014 of up to $1 billion (excluding applicable transaction
fees) of our outstanding Common Stock. On November 22, 2013, our
Board of Directors authorized additional share repurchases through
May 2015 of up to $750 million (excluding applicable transaction fees)
of our outstanding Common Stock. As of December 28, 2013, we have
$953 million available for future repurchases under these authorizations.
Changes in accumulated other comprehensive income (loss) (“OCI”) are presented below.
Translation Adjustments
and Gains (Losses) From
Intra-Entity Transactions
of a Long-Term Nature
Pension and Post-
Retirement Benefit
Plan Losses(a)(b)
Net Unrealized
Loss on Derivative
Instruments Total
Balance at December 31, 2011, net of tax $ 140 $ (375) $ (12) $ (247)
Amounts classified into OCI, net of tax 23 (10) (4) 9
Amounts reclassified from accumulated
OCI, net of tax 3 99 4 106
OCI, net of tax 26 89 — 115
Balance at December 29, 2012, net of tax 166 (286) (12) (132)
Amounts classified into OCI, net of tax 4 136 4 144
Amounts reclassified from accumulated
OCI, net of tax — 53 (1) 52
OCI, net of tax 4 189 3 196
Balance at December 28, 2013, net of tax $ 170 $ (97
)
$ (9
)
$ 64
(a) Amounts reclassified from accumulated OCI to pension and post-retirement benefit plan losses during 2012 include amortization of net losses of $66 million, settlement charges
of$89million, amortization of prior service cost of $1 million and the related income tax benefit of $57 million. See Note 14 Pension Benefits for further information.
(b) Amounts reclassified from accumulated OCI for pension and post-retirement benefit plan losses during 2013 include amortization of net losses of $51 million, settlement charges of
$30million, amortization of prior service cost of $2 million and the related income tax benefit of $30 million. See Note 14 Pension Benefits for further information.