Pizza Hut 2013 Annual Report Download - page 151
Download and view the complete annual report
Please find page 151 of the 2013 Pizza Hut annual report below. You can navigate through the pages in the report by either clicking on the pages listed below, or by using the keyword search tool below to find specific information within the annual report.-
 1
1 -
2
-
3
-
4
-
5
-
6
-
7
-
8
-
9
-
10
-
11
-
12
-
13
-
14
-
15
-
16
-
17
-
18
-
19
-
20
-
21
-
22
-
23
-
24
-
25
-
26
-
27
-
28
-
29
-
30
-
31
-
32
-
33
-
34
-
35
-
36
-
37
-
38
-
39
-
40
-
41
-
42
-
43
-
44
-
45
-
46
-
47
-
48
-
49
-
50
-
51
-
52
-
53
-
54
-
55
-
56
-
57
-
58
-
59
-
60
-
61
-
62
-
63
-
64
-
65
-
66
-
67
-
68
-
69
-
70
-
71
-
72
-
73
-
74
-
75
-
76
-
77
-
78
-
79
-
80
-
81
-
82
-
83
-
84
-
85
-
86
-
87
-
88
-
89
-
90
-
91
-
92
-
93
-
94
-
95
-
96
-
97
-
98
-
99
-
100
-
101
-
102
-
103
-
104
-
105
-
106
-
107
-
108
-
109
-
110
-
111
-
112
-
113
-
114
-
115
-
116
-
117
-
118
-
119
-
120
-
121
-
122
-
123
-
124
-
125
-
126
-
127
-
128
-
129
-
130
-
131
-
132
-
133
-
134
-
135
-
136
-
137
-
138
-
139
-
140
-
 141
141 -
 142
142 -
 143
143 -
 144
144 -
 145
145 -
 146
146 -
 147
147 -
 148
148 -
 149
149 -
 150
150 -
 151
151 -
 152
152 -
 153
153 -
 154
154 -
 155
155 -
 156
156 -
 157
157 -
 158
158 -
 159
159 -
 160
160 -
 161
161 -
162
-
163
-
164
-
165
-
166
-
167
-
168
-
169
-
170
-
171
-
172
-
173
-
174
-
175
-
176
-
177
-
178
 |
 |

YUM! BRANDS, INC.-2013 Form10-K 55
Form 10-K
PART II
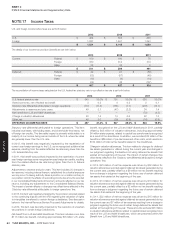
ITEM 8Financial Statements andSupplementaryData
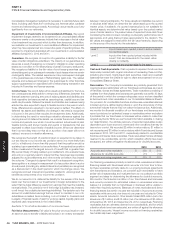
The annual maturities of short-term borrowings and long-term debt as of December 28, 2013, excluding capital lease obligations of $172 million and fair value
hedge accounting adjustments of $14 million, are as follows:
Year ended:
2014 $ 58
2015 250
2016 300
2017 —
2018 325
Thereafter 1,875
TOTAL $ 2,808
Interest expense on short-term borrowings and long-term debt was $270 million, $169 million and $184 million in 2013, 2012 and 2011, respectively.
2013 included $118 million in losses recorded in Interest expense, net as a result of premiums paid and other costs related to the extinguishment of
debt. See Losses Related to the Extinguishment of Debt section of Note 4 for further discussion.
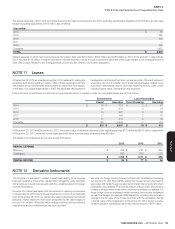
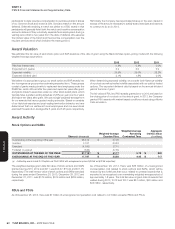
NOTE11 Leases
At December 28, 2013 we operated more than 8,100 restaurants, leasing the
underlying land and/or building in nearly 7,300 of those restaurants with the
vast majority of our commitments expiring within 20 years from the inception
of the lease. Our longest lease expires in 2087. We also lease office space for
headquarters and support functions, as well as certain office and restaurant
equipment. We do not consider any of these individual leases material to our
operations. Most leases require us to pay related executory costs, which
include property taxes, maintenance and insurance.
Future minimum commitments and amounts to be received as lessor or sublessor under non-cancelable leases are set forth below:
Commitments Lease Receivables
Capital Operating Direct Financing Operating
2014 $ 18 $ 721 $ 2 $ 61
2015 19 672 2 56
2016 19 627 3 52
2017 17 569 2 47
2018 17 515 2 43
Thereafter 186 2,593 7 152
$ 276 $ 5,697 $ 18 $ 411
At December 28, 2013 and December 29, 2012, the present value of minimum payments under capital leases was $172 million and $170 million, respectively.
At December 28, 2013, unearned income associated with direct financing lease receivables was $6 million.
The details of rental expense and income are set forth below:
2013 2012 2011
RENTAL EXPENSE
Minimum $ 759 $ 721 $ 625
Contingent 293 290 233
$ 1,052 $ 1,011 $ 858
RENTAL INCOME $ 94 $ 77 $ 66
NOTE12 Derivative Instruments
The Company is exposed to certain market risks relating to its ongoing
business operations. The primary market risks managed by using derivative
instruments are interest rate risk and cash flow volatility arising from foreign
currency fluctuations�
We enter into interest rate swaps with the objective of reducing our exposure
to interest rate risk and lowering interest expense for a portion of our fixed-rate
debt. At December 28, 2013, our interest rate swaps outstanding had notional
amounts of $300 million and have been designated as fair value hedges of
a portion of our debt. These fair value hedges meet the shortcut method
requirements and no ineffectiveness has been recorded.
We enter into foreign currency forward contracts with the objective of reducing
our exposure to cash flow volatility arising from foreign currency fluctuations
associated with certain foreign currency denominated intercompany short-term
receivables and payables� The notional amount, maturity date, and currency
of these contracts match those of the underlying receivables or payables� For
those foreign currency exchange forward contracts that we have designated
as cash flow hedges, we measure ineffectiveness by comparing the cumulative
change in the fair value of the forward contract with the cumulative change
in the fair value of the hedged item� At December 28, 2013, foreign currency
forward contracts outstanding had a total notional amount of $141 million�