Pizza Hut 2013 Annual Report Download - page 111
Download and view the complete annual report
Please find page 111 of the 2013 Pizza Hut annual report below. You can navigate through the pages in the report by either clicking on the pages listed below, or by using the keyword search tool below to find specific information within the annual report.-
 1
1 -
2
-
3
-
4
-
5
-
6
-
7
-
8
-
9
-
10
-
11
-
12
-
13
-
14
-
15
-
16
-
17
-
18
-
19
-
20
-
21
-
22
-
23
-
24
-
25
-
26
-
27
-
28
-
29
-
30
-
31
-
32
-
33
-
34
-
35
-
36
-
37
-
38
-
39
-
40
-
41
-
42
-
43
-
44
-
45
-
46
-
47
-
48
-
49
-
50
-
51
-
52
-
53
-
54
-
55
-
56
-
57
-
58
-
59
-
60
-
61
-
62
-
63
-
64
-
65
-
66
-
67
-
68
-
69
-
70
-
71
-
72
-
73
-
74
-
75
-
76
-
77
-
78
-
79
-
80
-
81
-
82
-
83
-
84
-
85
-
86
-
87
-
88
-
89
-
90
-
91
-
92
-
93
-
94
-
95
-
96
-
97
-
98
-
99
-
100
-
 101
101 -
 102
102 -
 103
103 -
 104
104 -
 105
105 -
 106
106 -
 107
107 -
 108
108 -
 109
109 -
 110
110 -
 111
111 -
 112
112 -
 113
113 -
 114
114 -
 115
115 -
 116
116 -
 117
117 -
 118
118 -
 119
119 -
 120
120 -
 121
121 -
122
-
123
-
124
-
125
-
126
-
127
-
128
-
129
-
130
-
131
-
132
-
133
-
134
-
135
-
136
-
137
-
138
-
139
-
140
-
141
-
142
-
143
-
144
-
145
-
146
-
147
-
148
-
149
-
150
-
151
-
152
-
153
-
154
-
155
-
156
-
157
-
158
-
159
-
160
-
161
-
162
-
163
-
164
-
165
-
166
-
167
-
168
-
169
-
170
-
171
-
172
-
173
-
174
-
175
-
176
-
177
-
178
 |
 |

YUM! BRANDS, INC.-2013 Form10-K 15
Form 10-K
PART II
ITEM7Management’s Discussion and Analysis of Financial Condition and Results of Operations
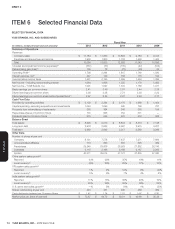
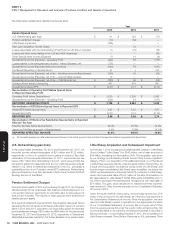
(a) Closures and impairment income (expense) includes $295 million of Little Sheep impairment losses in 2013, $80 million of net losses related to the LJS and A&W divestitures in 2011 and
$26 million and $12 million of goodwill impairment charges in 2009 recorded within our U.S. Division and Pizza Hut Korea business, respectively.
(b) See Note 4 for discussion of Refranchising Gain (Loss) for fiscal years 2013, 2012 and 2011. Fiscal year 2010 included a $52 million loss on the refranchising of our Mexico equity market.
(c) In addition to the results provided in accordance with U.S. Generally Accepted Accounting Principles (“GAAP”) throughout this document, the Company has provided non-GAAP measurements
which present operating results on a basis before Special Items. The Company uses earnings before Special Items as a key performance measure of results of operations for the purpose of
evaluating performance internally. This non-GAAP measurement is not intended to replace the presentation of our financial results in accordance with GAAP.Rather, the Company believes
that the presentation of earnings before Special Items provides additional information to investors to facilitate the comparison of past and present operations, excluding items that the
Company does not believe are indicative of our ongoing operations due to their size and/or nature.
2013, 2012 and 2011 Special Items are described in further detail within our MD&A. Special Items in 2010 negatively impacted Operating Profit by $77 million, primarily due to $59 million
in refranchising losses for equity markets outside the U.S. and U.S. refranchising net losses of $18 million. Special Items in 2009 positively impacted Operating Profit by $18 million, primarily
due to a gain of $68 million upon our acquisition of additional ownership interest in, and consolidation of, the operating entity that owns KFCs in Shanghai China, U.S. refranchising net gains
of $34 million, offset by investments in our U.S. brands of $32 million, a U.S. goodwill impairment charge of $26 million and charges of $16 million relating to U.S. General and Administrative
(“G&A”) productivity initiatives and realignment of resources. These items above resulted in cumulative net tax benefits of $7 million and $5 million in 2010 and 2009, respectively.
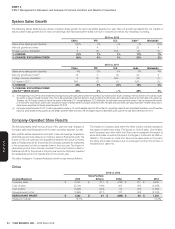
(d) System sales growth includes the results of all restaurants regardless of ownership, including Company-owned, franchise, unconsolidated affiliate and license restaurants that operate
our concepts, except for non-Company-owned restaurants for which we do not receive a sales-based royalty. Sales of franchise, unconsolidated affiliate and license restaurants generate
franchise and license fees for the Company (typically at a rate of 4% to 6% of sales). Franchise, unconsolidated affiliate and license restaurant sales are not included in Company sales on the
Consolidated Statements of Income; however, the franchise and license fees are included in the Company’s revenues. We believe system sales growth is useful to investors as a significant
indicator of the overall strength of our business as it incorporates all of our revenue drivers, Company and franchise same-store sales as well as net unit development. Same-store sales
growth includes the estimated growth in sales of all restaurants that have been open and in the YUM system one year or more.
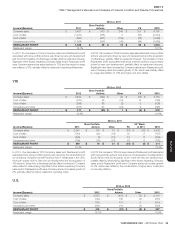
(e) Local currency represents the percentage change excluding the impact of foreign currency translation. These amounts are derived by translating current year results at prior year average
exchange rates. We believe the elimination of the foreign currency translation impact provides better year-to-year comparability without the distortion of foreign currency fluctuations.
Fiscal years 2013, 2012, 2010 and 2009 include 52 weeks and fiscal year 2011 includes 53 weeks. See Management’s Discussion and Analysis of
Financial Condition and Results of Operations (“MD&A”) for discussion of the impact of the 53rd week in fiscal year 2011.
The selected financial data should be read in conjunction with the Consolidated Financial Statements.
ITEM7 Management’s Discussion and Analysis
of Financial Condition and Results
of Operations
Introduction and Overview
The following Management’s Discussion and Analysis (“MD&A”), should
be read in conjunction with the Consolidated Financial Statements on
pages 36 through 71 (“Financial Statements”) and the Forward-Looking
Statements on page 2 and the Risk Factors set forth in Item 1A.Throughout
the MD&A, YUM! Brands, Inc. (“YUM” or the “Company”) makes reference
to certain performance measures as described below.
•
The Company provides the percentage changes excluding the impact of
foreign currency translation (“FX” or “Forex”). These amounts are derived
by translating current year results at prior year average exchange rates.
We believe the elimination of the foreign currency translation impact
provides better year-to-year comparability without the distortion of
foreign currency fluctuations.
•
System sales growth includes the results of all restaurants regardless of
ownership, including Company-owned, franchise, unconsolidated affiliate
and license restaurants that operate our Concepts, except for non-
company-owned restaurants for which we do not receive a sales-based
royalty. Sales of franchise, unconsolidated affiliate and license restaurants
generate franchise and license fees for the Company (typically at a rate
of 4% to 6% of sales). Franchise, unconsolidated affiliate and license
restaurant sales are not included in Company sales on the Consolidated
Statements of Income; however, the franchise and license fees are
included in the Company’s revenues. We believe system sales growth
is useful to investors as a significant indicator of the overall strength of
our business as it incorporates all of our revenue drivers, Company and
franchise same-store sales as well as net unit development.
•
Same-store sales is the estimated growth in sales of all restaurants that
have been open and in the YUM system one year or more. The impact
of same-store sales growth on both our Company-owned store results
and Franchise and license fees and income is described elsewhere in
this MD&A.
•Company restaurant profit is defined as Company sales less expenses
incurred directly by our Company restaurants in generating Company
sales. Company restaurant margin as a percentage of sales is defined
as Company restaurant profit divided by Company sales.
•
Operating margin is defined as Operating Profit divided by Total revenue.
All Note references herein refer to the Notes to the Financial Statements
on pages 43 through 71. Tabular amounts are displayed in millions of
U.S. dollars except per share and unit count amounts, or as otherwise
specifically identified. Percentages may not recompute due to rounding.
Description of Business
YUM has over 40,000 restaurants in more than 125 countries and territories
operating primarily under the KFC, Pizza Hut or Taco Bell brands, which are
the global leaders in the chicken, pizza and Mexican-style food categories,
respectively. Of the over 40,000 restaurants, 20% are operated by the
Company, 75% are operated by franchisees and unconsolidated affiliates
and 5% are operated by licensees.