Pizza Hut 2013 Annual Report Download - page 59
Download and view the complete annual report
Please find page 59 of the 2013 Pizza Hut annual report below. You can navigate through the pages in the report by either clicking on the pages listed below, or by using the keyword search tool below to find specific information within the annual report.
YUM! BRANDS, INC.-2014Proxy Statement 37
Proxy Statement
EXECUTIVE COMPENSATION
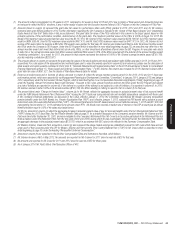
Detailed Breakdown of 2013 Team Performance
The team performance targets, actual results, weights and overall performance for each measure for our NEOs are outlined
below.
TEAM PERFORMANCE
NEO Measures Target Actual
Earned
Award as %
of Target Weighting
Final Team
Performance
Novak, Grismer Weighted Average Divisions’ Team Factors(1) 89 50% 45
Earnings Per Share Growth
(excluding special items)
10% (9)% 0 50% 0
FINAL YUM TEAM FACTOR 45
Su Operating Profit Growth(2) 12% (26)% 0 50% 0
System Sales Growth 15% (4)% 0 20% 0
System Gross New Builds 650 740 200 20% 40
System Customer Satisfaction 100 172 172 10% 17
Total Weighted Team Performance -
ChinaDivision 57
FINAL CHINA TEAM FACTOR(3) 54
Creed Operating Profit Growth(5) 6% 8% 147 40% 59
System Same-Store Sales Growth 3% 3% 85 20% 17
Restaurant Margin 18% 19% 200 20% 40
System Customer Satisfaction Blended Blended 171 20% 34
Total Weighted Team Performance -
Taco Bell 150
Final Taco Bell Team Factor(3) 124
FINAL TACO BELL TEAM FACTOR WITH
CHAIRMAN’S INCENTIVE POINTS(4)
139
Pant Operating Profit Growth(2)(6) 10% 9% 72 50% 36
System Sales Growth 6% 5% 71 15% 11
System Net Builds 500 604 200 20% 40
System Customer Satisfaction Blended Blended 130 15% 19
Total Weighted Team Performance –
YRI Division 106
FINAL YRI TEAM FACTOR(3) 91
(1) Weighted average based on each Division’s contribution to overall segment operating profit of YUM in 2013, not including the 15 Chairman’s Incentive Points
given to Taco Bell.
(2) Excludes the impact of foreign exchange.
(3) Final team factor reflects 75% division and 25% YUM weighting.
(4) Taco Bell received 15 additional discretionary points for being named marketer of the year, sharing know how, highest overall operating results in the
Company, and external recognition of operations measures.
(5) Actual operating profit growth target was adjusted for the impact of refranchising in 2012 and 2013.
(6) Actual operating profit growth target was adjusted for the impact of certain non-recurring costs within our Pizza Hut U.K. market in 2012.


