Pizza Hut 2013 Annual Report Download - page 72
Download and view the complete annual report
Please find page 72 of the 2013 Pizza Hut annual report below. You can navigate through the pages in the report by either clicking on the pages listed below, or by using the keyword search tool below to find specific information within the annual report.-
 1
1 -
2
-
3
-
4
-
5
-
6
-
7
-
8
-
9
-
10
-
11
-
12
-
13
-
14
-
15
-
16
-
17
-
18
-
19
-
20
-
21
-
22
-
23
-
24
-
25
-
26
-
27
-
28
-
29
-
30
-
31
-
32
-
33
-
34
-
35
-
36
-
37
-
38
-
39
-
40
-
41
-
42
-
43
-
44
-
45
-
46
-
47
-
48
-
49
-
50
-
51
-
52
-
53
-
54
-
55
-
56
-
57
-
58
-
59
-
60
-
61
-
 62
62 -
 63
63 -
 64
64 -
 65
65 -
 66
66 -
 67
67 -
 68
68 -
 69
69 -
 70
70 -
 71
71 -
 72
72 -
 73
73 -
 74
74 -
 75
75 -
 76
76 -
 77
77 -
 78
78 -
 79
79 -
 80
80 -
 81
81 -
 82
82 -
83
-
84
-
85
-
86
-
87
-
88
-
89
-
90
-
91
-
92
-
93
-
94
-
95
-
96
-
97
-
98
-
99
-
100
-
101
-
102
-
103
-
104
-
105
-
106
-
107
-
108
-
109
-
110
-
111
-
112
-
113
-
114
-
115
-
116
-
117
-
118
-
119
-
120
-
121
-
122
-
123
-
124
-
125
-
126
-
127
-
128
-
129
-
130
-
131
-
132
-
133
-
134
-
135
-
136
-
137
-
138
-
139
-
140
-
141
-
142
-
143
-
144
-
145
-
146
-
147
-
148
-
149
-
150
-
151
-
152
-
153
-
154
-
155
-
156
-
157
-
158
-
159
-
160
-
161
-
162
-
163
-
164
-
165
-
166
-
167
-
168
-
169
-
170
-
171
-
172
-
173
-
174
-
175
-
176
-
177
-
178
 |
 |

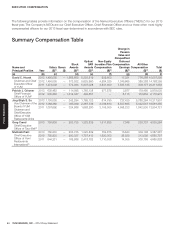
YUM! BRANDS, INC.-2014Proxy Statement50
Proxy Statement
EXECUTIVE COMPENSATION
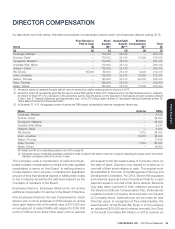
Option Exercises and Stock Vested
The table below shows the number of shares of YUM common stock acquired during 2013 upon exercise of stock option
and SAR awards and vesting of stock awards in the form of RSUs and PSUs, each including accumulated dividends and
before payment of applicable withholding taxes and broker commissions. For 2013, no RSUs became vested and 2011
PSU awards for the 2011-2013 performance cycle were not paid out since the average earnings per share during the
performance cycle did not reach the required minimum average growth threshold of seven percent. Therefore, there is
nothing to report for the NEOs in columns (d) and (e).
Name
Option/SAR Awards Stock Awards
Number
of Shares
Acquired on
Exercise
(#)
Value
Realized on
Exercise
($)
Number
of Shares
Acquired on
Vesting
(#)
Value
realized on
Vesting
($)
(a) (b) (c) (d) (e)
Novak 334,272 17,315,657 — —
Grismer 32,503 1,543,414 — —
Su 175,228 9,417,664 — —
Creed 189,901 13,122,211 — —
Pant 12,865 629,923 — —