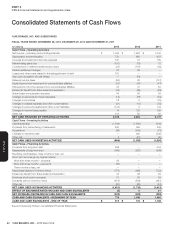
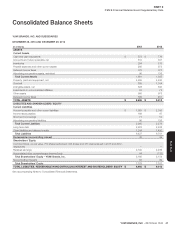
Pizza Hut 2013 Annual Report Download - page 135
Download and view the complete annual report
Please find page 135 of the 2013 Pizza Hut annual report below. You can navigate through the pages in the report by either clicking on the pages listed below, or by using the keyword search tool below to find specific information within the annual report.-
 1
1 -
2
-
3
-
4
-
5
-
6
-
7
-
8
-
9
-
10
-
11
-
12
-
13
-
14
-
15
-
16
-
17
-
18
-
19
-
20
-
21
-
22
-
23
-
24
-
25
-
26
-
27
-
28
-
29
-
30
-
31
-
32
-
33
-
34
-
35
-
36
-
37
-
38
-
39
-
40
-
41
-
42
-
43
-
44
-
45
-
46
-
47
-
48
-
49
-
50
-
51
-
52
-
53
-
54
-
55
-
56
-
57
-
58
-
59
-
60
-
61
-
62
-
63
-
64
-
65
-
66
-
67
-
68
-
69
-
70
-
71
-
72
-
73
-
74
-
75
-
76
-
77
-
78
-
79
-
80
-
81
-
82
-
83
-
84
-
85
-
86
-
87
-
88
-
89
-
90
-
91
-
92
-
93
-
94
-
95
-
96
-
97
-
98
-
99
-
100
-
101
-
102
-
103
-
104
-
105
-
106
-
107
-
108
-
109
-
110
-
111
-
112
-
113
-
114
-
115
-
116
-
117
-
118
-
119
-
120
-
121
-
122
-
123
-
124
-
 125
125 -
 126
126 -
 127
127 -
 128
128 -
 129
129 -
 130
130 -
 131
131 -
 132
132 -
 133
133 -
 134
134 -
 135
135 -
 136
136 -
 137
137 -
 138
138 -
 139
139 -
 140
140 -
 141
141 -
 142
142 -
 143
143 -
 144
144 -
 145
145 -
146
-
147
-
148
-
149
-
150
-
151
-
152
-
153
-
154
-
155
-
156
-
157
-
158
-
159
-
160
-
161
-
162
-
163
-
164
-
165
-
166
-
167
-
168
-
169
-
170
-
171
-
172
-
173
-
174
-
175
-
176
-
177
-
178
 |
 |

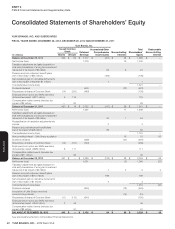
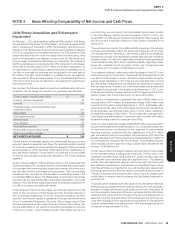
YUM! BRANDS, INC.-2013 Form10-K 39
Form 10-K
PART II
ITEM 8Financial Statements andSupplementaryData
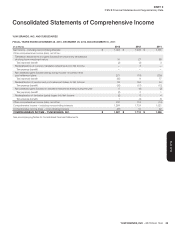
Consolidated Statements of Comprehensive Income
YUM! BRANDS, INC. AND SUBSIDIARIES
FISCAL YEARS ENDED DECEMBER 28, 2013, DECEMBER 29, 2012 AND DECEMBER 31, 2011
(in millions)
2013 2012 2011
Net income – including noncontrolling interests $ 1,064 $ 1,608 $ 1,335
Other comprehensive income (loss), net of tax:
Translation adjustments and gains (losses) from intra-entity transactions
of a long-term investment nature 10 27 88
Tax (expense) benefit (2) (3) 3
Reclassifications of currency translation adjustments into Net Income — 3 —
Tax expense (benefit) — — —
Net unrealized gains (losses) arising during the year on pension and
post-retirementplans 221 (19) (205)
Tax (expense) benefit (85) 9 77
Reclassification of pension and post-retirement losses to Net Income 83 156 34
Tax expense (benefit) (30) (57) (12)
Net unrealized gains (losses) on derivative instruments arising during the year 6 (6) (3)
Tax (expense) benefit (2) 2 1
Reclassification of derivative (gains) losses into Net Income (2) 6 4
Tax expense (benefit) 1 (2) (1)
Other comprehensive income (loss), net of tax 200 116 (14)
Comprehensive Income – including noncontrolling interests 1,264 1,724 1,321
Comprehensive Income (loss) – noncontrolling interests (23) 12 22
COMPREHENSIVE INCOME – YUM! BRANDS, INC. $ 1,287 $ 1,712 $ 1,299
See accompanying Notes to Consolidated Financial Statements.