Pizza Hut 2013 Annual Report Download - page 117
Download and view the complete annual report
Please find page 117 of the 2013 Pizza Hut annual report below. You can navigate through the pages in the report by either clicking on the pages listed below, or by using the keyword search tool below to find specific information within the annual report.-
 1
1 -
2
-
3
-
4
-
5
-
6
-
7
-
8
-
9
-
10
-
11
-
12
-
13
-
14
-
15
-
16
-
17
-
18
-
19
-
20
-
21
-
22
-
23
-
24
-
25
-
26
-
27
-
28
-
29
-
30
-
31
-
32
-
33
-
34
-
35
-
36
-
37
-
38
-
39
-
40
-
41
-
42
-
43
-
44
-
45
-
46
-
47
-
48
-
49
-
50
-
51
-
52
-
53
-
54
-
55
-
56
-
57
-
58
-
59
-
60
-
61
-
62
-
63
-
64
-
65
-
66
-
67
-
68
-
69
-
70
-
71
-
72
-
73
-
74
-
75
-
76
-
77
-
78
-
79
-
80
-
81
-
82
-
83
-
84
-
85
-
86
-
87
-
88
-
89
-
90
-
91
-
92
-
93
-
94
-
95
-
96
-
97
-
98
-
99
-
100
-
101
-
102
-
103
-
104
-
105
-
106
-
 107
107 -
 108
108 -
 109
109 -
 110
110 -
 111
111 -
 112
112 -
 113
113 -
 114
114 -
 115
115 -
 116
116 -
 117
117 -
 118
118 -
 119
119 -
 120
120 -
 121
121 -
 122
122 -
 123
123 -
 124
124 -
 125
125 -
 126
126 -
 127
127 -
128
-
129
-
130
-
131
-
132
-
133
-
134
-
135
-
136
-
137
-
138
-
139
-
140
-
141
-
142
-
143
-
144
-
145
-
146
-
147
-
148
-
149
-
150
-
151
-
152
-
153
-
154
-
155
-
156
-
157
-
158
-
159
-
160
-
161
-
162
-
163
-
164
-
165
-
166
-
167
-
168
-
169
-
170
-
171
-
172
-
173
-
174
-
175
-
176
-
177
-
178
 |
 |

YUM! BRANDS, INC.-2013 Form10-K 21
Form 10-K
PART II
ITEM7Management’s Discussion and Analysis of Financial Condition and Results of Operations
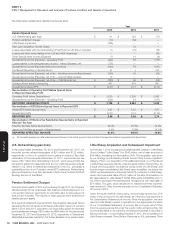
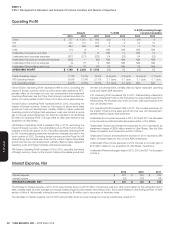
The following table summarizes the impact of refranchising on Total revenues as described above:
2013
China YRI U.S. India Worldwide
Decreased Company sales $ (54) $ (439 ) $ (481) $ — $ (974 )
Increased Franchise and license fees
andincome 7 23 32 — 62
DECREASE IN TOTAL REVENUES $ (47) $ (416 ) $ (449) $ — $ (912 )
2012
China YRI U.S. India Worldwide
Decreased Company sales $ (54) $ (113) $ (606) $ — $ (773)
Increased Franchise and license fees
andincome 9 10 43 — 62
DECREASE IN TOTAL REVENUES $ (45) $ (103) $ (563) $ — $ (711)
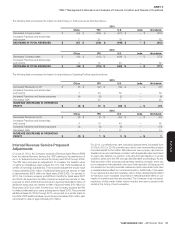
The following table summarizes the impact of refranchising on Operating Profit as described above:
2013
China YRI U.S. India Worldwide
Decreased Restaurant profit $ (6) $ (32) $ (59) $ — $ (97)
Increased Franchise and license fees
andincome 7 23 32 — 62
Increased Franchise and license expenses (4) (3) (2) — (9)
Decreased G&A — 22 7 — 29
INCREASE (DECREASE) IN OPERATING
PROFIT $ (3) $ 10 $ (22) $ — $ (15)
2012
China YRI U.S. India Worldwide
Decreased Restaurant profit $ (8) $ (7) $ (46) $ — $ (61)
Increased Franchise and license fees
andincome 9 10 43 — 62
Increased Franchise and license expenses (4) (4) (6) — (14)
Decreased G&A — 2 12 — 14
INCREASE (DECREASE) IN OPERATING
PROFIT $ (3) $ 1 $ 3 $ — $ 1
Internal Revenue Service Proposed
Adjustments
On June 23, 2010, the Company received a Revenue Agent Report (RAR)
from the Internal Revenue Service (the “IRS”) relating to its examination of
our U.S. federal income tax returns for fiscal years 2004 through 2006.
The IRS has proposed an adjustment to increase the taxable value
of rights to intangibles used outside the U.S. that YUM transferred to
certain of its foreign subsidiaries. The proposed adjustment would result
in approximately $700 million of additional taxes plus net interest to date
of approximately $255 million for fiscal years 2004-2006. On January 9,
2013, the Company received an RAR from the IRS for fiscal years 2007
and 2008. As expected, the IRS proposed an adjustment similar to their
proposal for 2004-2006 that would result in approximately $270 million of
additional taxes plus net interest to date of approximately $40 million for
fiscal years 2007 and 2008. Furthermore, the Company expects the IRS
to make similar claims for years subsequent to fiscal 2008. The potential
additional taxes for 2009 through 2013, computed on a similar basis to
the 2004-2008 additional taxes, would be approximately $140 million plus
net interest to date of approximately $10 million.
For 2013, our effective tax rate, excluding Special Items, increased from
25.8% in 2012 to 28.0% primarily as a result of an incremental provision
recorded related to this matter. We believe we have properly reported our
taxable income and paid taxes consistent with all applicable laws and intend
to vigorously defend our position, including through litigation, if we are
unable to settle with the IRS through administrative proceedings. As the
final resolution of the proposed adjustments remains uncertain, there can
be no assurance that payments due upon final resolution of this issue will
not exceed our currently recorded reserve and such payments could have
a material adverse effect on our financial position. Additionally, if increases
to our reserves are deemed necessary due to future developments related
to this issue, such increases could have a material adverse effect on our
results of operations as they are recorded. The Company does not expect
resolution of this matter within twelve months and cannot predict with
certainty the timing of such resolution.