Pizza Hut 2013 Annual Report Download - page 154
Download and view the complete annual report
Please find page 154 of the 2013 Pizza Hut annual report below. You can navigate through the pages in the report by either clicking on the pages listed below, or by using the keyword search tool below to find specific information within the annual report.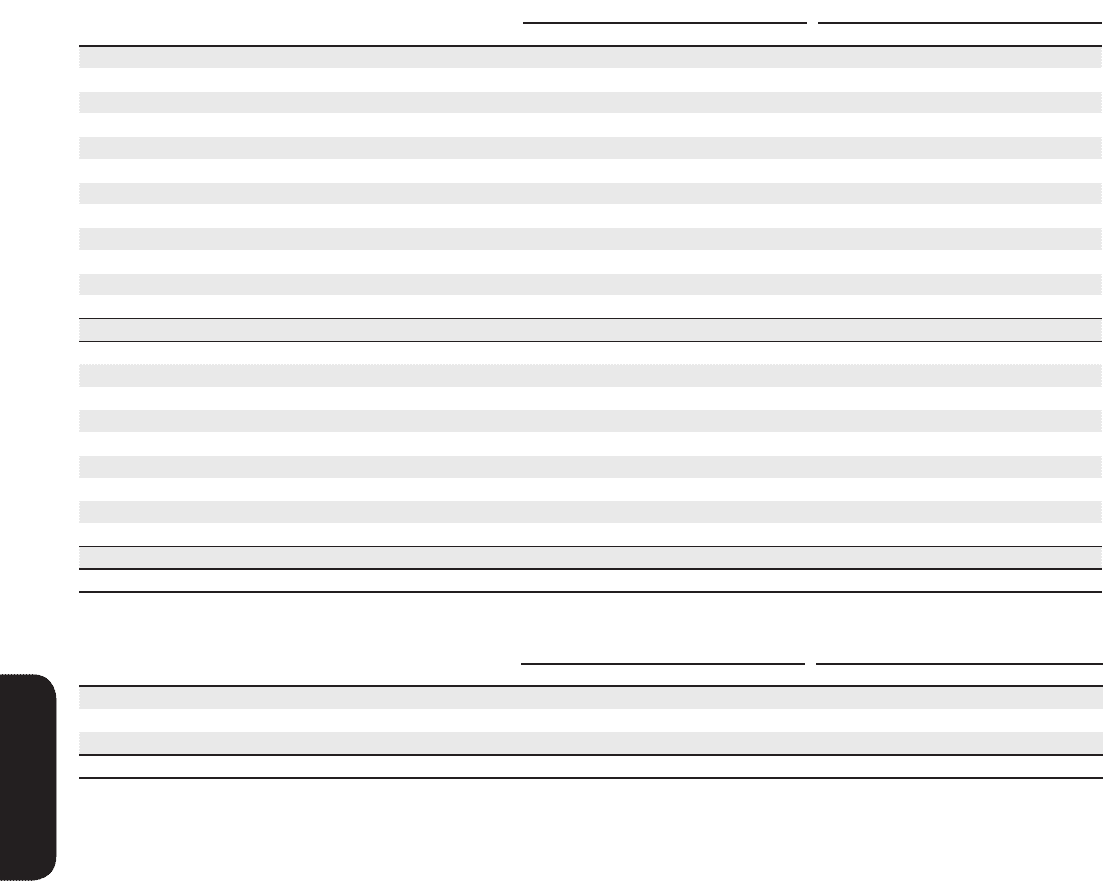
YUM! BRANDS, INC.-2013 Form10-K58
Form 10-K
PART II
ITEM 8Financial Statements andSupplementaryData
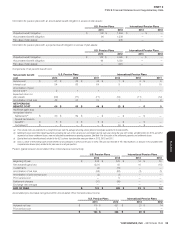
Obligation and Funded Status at Measurement Date:
The following chart summarizes the balance sheet impact, as well as benefit obligations, assets, and funded status associated with our significant U.S.
and International pension plans. The actuarial valuations for all plans reflect measurement dates coinciding with our fiscal year ends.
U.S. Pension Plans International Pension Plans
2013 2012 2013 2012
Change in benefit obligation
Benefit obligation at beginning of year $ 1,290 $ 1,381 $ 193 $ 187
Service cost 21 26 1 2
Interest cost 54 66 8 8
Participant contributions — — — 1
Plan amendments — 5 — —
Curtailments (3) (10) (5) —
Special termination benefits 5 3 — —
Exchange rate changes — — 4 5
Benefits paid (21) (14) (3) (4)
Settlements(a)(b) (151) (278) — —
Actuarial (gain) loss (170) 111 28 (6)
Benefit obligation at end of year $ 1,025 $ 1,290 $ 226 $ 193
Change in plan assets
Fair value of plan assets at beginning of year $ 945 $ 998 $ 226 $ 183
Actual return on plan assets 116 144 30 21
Employer contributions 22 100 1 19
Participant contributions — — — 1
Settlement payments(a) (123) (278) — —
Benefits paid (21) (14) (3) (4)
Exchange rate changes — — 5 6
Administrative expenses (6) (5) — —
Fair value of plan assets at end of year $ 933 $ 945 $ 259 $ 226
FUNDED STATUS AT END OF YEAR $ (92) $ (345) $ 33 $ 33
Amounts recognized in the Consolidated Balance Sheet:
U.S. Pension Plans International Pension Plans
2013 2012 2013 2012
Prepaid benefit asset – non-current $ 10 $ — $ 33 $ 33
Accrued benefit liability – current (8) (19) — —
Accrued benefit liability – non-current (94) (326) — —
$ (92) $ (345) $ 33 $ 33
(a) For discussion of the settlement payments and settlement losses, see Pension Settlement Charges section of Note 4.
(b) 2013 includes the transfer of certain non-qualified pension benefits into a defined benefit plan not included in the table above due to its insignificance.
The accumulated benefit obligation for the U.S. and International pension plans was $1,209 million and $1,426 million at December 28, 2013 and
December 29, 2012, respectively.


